
[vc_row margintop=”0″ marginbottom=”15″ paddingtop=”0″ paddingbottom=”0″ bg_color=”#ffffff” bg_repeat=”repeat” bg_stretch=”no” en_border=”no” border_color=”#e8e8e8″][vc_column][vc_column_text]Table of Contents:
Step 1: Calculating Reflectance value from the Satellite data
Step 2: Correcting the Reflectance value with sun angle
Step 3: Calculating NDVI from 4th and 5th bands
Step 4: Calculating SAVI from Reflectance
Step 5: Calculating Tasseled cap indices
Step 6: Tasseled cap Brightness indices
Step 7: Similarly calculate the other indices Tasseled cap wetness index and Greenness index[/vc_column_text][/vc_column][/vc_row][vc_row margintop=”0″ marginbottom=”15″ paddingtop=”0″ paddingbottom=”0″ bg_color=”#ffffff” bg_repeat=”repeat” bg_stretch=”no” en_border=”no” border_color=”#e8e8e8″][vc_column][vc_column_text]
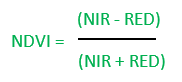
The Normalized Differential Vegetation Index (NDVI) is a standardized vegetation index which allows us to generate an image showing the relative biomass. The chlorophyll absorption in Red band and relatively high reflectance of vegetation in Near Infrared band (NIR) are using for calculating NDVI. ( From ESRI)
“An NDVI is often used worldwide to monitor drought, monitor and predict agricultural production, assist in predicting hazardous fire zones, and map desert encroachment. The NDVI is preferred for global vegetation monitoring because it helps to compensate for changing illumination conditions, surface slope, aspect, and other extraneous factors” (Lillesand 2004).
Monitoring the intensity and the density of the green vegetation growth can be done using the reflection from the red band and the infrared band. Green vegetation reflects more energy in the near- infrared band than in the visible range. It observe red band more for the photosynthesis process. Leaves reflects less in the near-infrared region when they are stressed, diseased or dead. Features like Clouds, water and snow show better reflection in the visible range then the near-infrared range, while the difference is almost zero for rock and bare soil.
Output of the NDVI method creates a single-band dataset that only shows greenery. Values close to zero represent rock and bare soil and negative values represent water, snow and clouds. Taking ratio or difference of two bands makes the vegetation growth signal differentiated from the the background signal. NDVI method was developed by the NASA scientist popularly known as Normalized Difference Vegetation Index (NDVI). By taking a ratio of two bands drop the values between -1 to +1. Table below shows the red and infrared bands reflectance values of features and their NDVI values. Water has an NDVI value less than 0, bare soils between 0 and 0.1, and vegetation over 0.1. Increase in the positive NDVI value means greener the vegetation.
RED= DN values from RED band
NIR= DN values from Near Infrared band[/vc_column_text][/vc_column][/vc_row][vc_row margintop=”0″ marginbottom=”15″ paddingtop=”0″ paddingbottom=”0″ bg_color=”#ffffff” bg_repeat=”repeat” bg_stretch=”no” en_border=”no” border_color=”#e8e8e8″][vc_column][vc_column_text]
|
COVER TYPE |
RED |
NIR |
NDVI |
|
Dense vegetation |
0.1 |
0.5 |
0.7 |
|
Dry Bare soil |
0.269 |
0.283 |
0.025 |
|
Clouds |
0.227 |
0.228 |
0.002 |
|
Snow and ice |
0.375 |
0.342 |
-0.046 |
|
Water |
0.022 |
0.013 |
-0.257 |
Fig: Table 1
[/vc_column_text][/vc_column][/vc_row][vc_row margintop=”0″ marginbottom=”15″ paddingtop=”0″ paddingbottom=”0″ bg_color=”#ffffff” bg_repeat=”repeat” bg_stretch=”no” en_border=”no” border_color=”#e8e8e8″][vc_column][vc_column_text]
Table shows typical reflectance values in the red and infrared channels, and the NDVI for typical cover types. Water typically has an NDVI value less than 0, bare soils between 0 and 0.1 and vegetation over 0.1.
Here we are using the Landsat image acquired from USGS Earth Explorer. The data is in GeoTiff format with 16 bit radiometric resolution (ranges from 0-65535). Landsat 8 Operational Land Imager (OLI) and Thermal Infrared Sensor (TIRS) images consist of nine spectral bands with a spatial resolution of 30 meters for Bands 1 to 7 and 9. The resolution for Band 8 (panchromatic) is 15 meters. In addition it also have two Thermal IR bands with a spatial resolution of 100m (later resampled into 30 m).Before calculating the NDVI the DN data must be converted to reflectance using the equations given in their website. Here the IR and NIR bands are 4 and 5 respectively.
[/vc_column_text][/vc_column][/vc_row][vc_row margintop=”0″ marginbottom=”15″ paddingtop=”0″ paddingbottom=”0″ bg_color=”#ffffff” bg_repeat=”repeat” bg_stretch=”no” en_border=”no” border_color=”#e8e8e8″][vc_column][vc_column_text]Table shows the Spectral characteristics of Landsat 8
|
Landsat 8 Operational Land Imager (OLI) and Thermal Infrared Sensor (TIRS) |
Bands |
Wavelength |
Resolution |
|
|
Band 1 – Coastal aerosol |
0.43 – 0.45 |
30 |
||
|
Band 2 – Blue |
0.45 – 0.51 |
30 |
||
|
Band 3 – Green |
0.53 – 0.59 |
30 |
||
|
Band 4 – Red |
0.64 – 0.67 |
30 |
||
|
Band 5 – Near Infrared (NIR) |
0.85 – 0.88 |
30 |
||
|
Band 6 – SWIR 1 |
1.57 – 1.65 |
30 |
||
|
Band 7 – SWIR 2 |
2.11 – 2.29 |
30 |
||
|
Band 8 – Panchromatic |
0.50 – 0.68 |
15 |
||
|
Band 9 – Cirrus |
1.36 – 1.38 |
30 |
||
|
Band 10 – Thermal Infrared |
10.60 – 11.19 |
100 * (30) |
||
|
Band 11 – Thermal Infrared |
11.50 – 12.51 |
100 * (30) |
(Obtained from USGS website)
[/vc_column_text][/vc_column][/vc_row][vc_row margintop=”0″ marginbottom=”15″ paddingtop=”0″ paddingbottom=”0″ bg_color=”#ffffff” bg_repeat=”repeat” bg_stretch=”no” en_border=”no” border_color=”#e8e8e8″][vc_column][vc_column_text]
Step 1: Calculating Reflectance value from the Satellite data
OLI spectral radiance data can also be converted to TOA planetary reflectance using reflectance rescaling coefficients provided in the landsat8 OLI metadata file. The following equation is used to convert DN values to TOA reflectance for OLI image:
[/vc_column_text][/vc_column][/vc_row][vc_row margintop=”0″ marginbottom=”15″ paddingtop=”0″ paddingbottom=”0″ bg_color=”#ffffff” bg_repeat=”repeat” bg_stretch=”no” en_border=”no” border_color=”#e8e8e8″][vc_column width=”1/2″][vc_column_text]
ρλ’ = M ρQ cal + A ρ[/vc_column_text][/vc_column][vc_column width=”1/2″][vc_column_text]Where:
ρλ’ = TOA planetary reflectance, without correction for solar angle. Note that ρλ’ does not contain a correction for the sun angle.
M ρ = Band-specific multiplicative rescaling factor from the metadata (Reflectance_Mult_Band_x, where x is the band number)
A ρ = Band-specific additive rescaling factor from the metadata (Reflectance_Add_Band_x, where x is the band number)
Q cal = Quantized and calibrated standard product pixel values (DN).
(Metadata means the .txt file you can find along with the data)[/vc_column_text][/vc_column][/vc_row][vc_row margintop=”0″ marginbottom=”15″ paddingtop=”0″ paddingbottom=”0″ bg_color=”#ffffff” bg_repeat=”repeat” bg_stretch=”no” en_border=”no” border_color=”#e8e8e8″][vc_column][vc_column_text]I. Open ArcMap and add satellite images band 4 and band 5 for calculating NDVI.

II. Open Arc toolbox in ArcMap
II. From the Arc toolbox open Raster calculator (Arc toolbox >Spatial Analyst tool > Map Algebra tool > Raster Calculator tool)
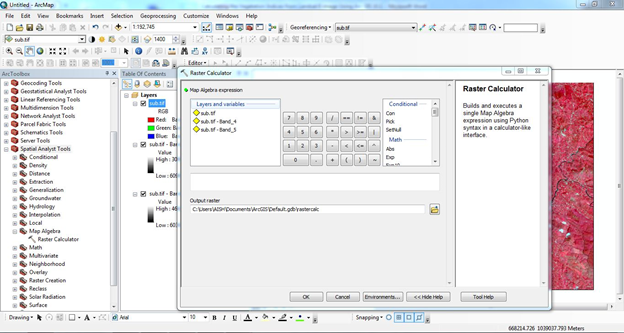 [/vc_column_text][/vc_column][/vc_row][vc_row margintop=”0″ marginbottom=”15″ paddingtop=”0″ paddingbottom=”0″ bg_color=”#ffffff” bg_repeat=”repeat” bg_stretch=”no” en_border=”no” border_color=”#e8e8e8″][vc_column][vc_column_text]IV. Find M ρ Band-specific multiplicative rescaling factor from the metadata (Reflectance_Mult_Band_x, where x is the band number)
A ρ Band-specific additive rescaling factor from the metadata (Reflectance_Add_Band_x, where x is the band number)
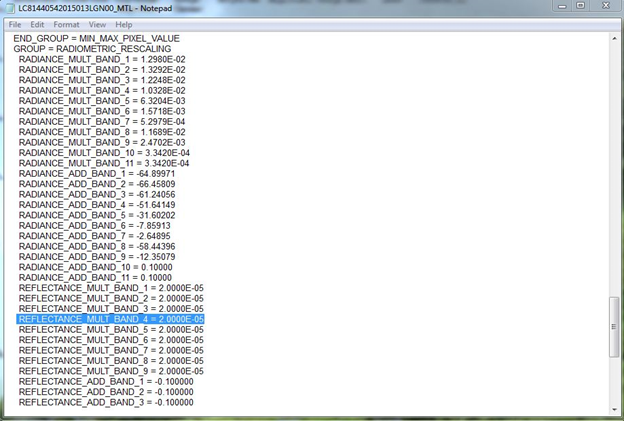
An example of where the M ρ Band-specific multiplicative rescaling factor from the metadata
(Reflectance_Mult_Band_x, where x is the band number) is found within the metadata file
Apply and perform values in Raster calculator for both RED and NIR bands (4 and 5 bands)
Example
Band 4 reflectance= (2.0000E-05 * (“sub_tif_Band_4”)) + -0.100000
Where
REFLECTANCE_MULT_BAND_4 = 2.0000E-05
RFLECTANCE_ADD_BAND_4 = -0.100000
sub_tif_Band_4= 4th band (Red band)
Set the output folder and file name then click “OK”
[/vc_column_text][/vc_column][/vc_row][vc_row margintop=”0″ marginbottom=”15″ paddingtop=”0″ paddingbottom=”0″ bg_color=”#ffffff” bg_repeat=”repeat” bg_stretch=”no” en_border=”no” border_color=”#e8e8e8″][vc_column][vc_column_text]
Raster Calculator function to perform reflectance calculation

Reflectance calculated for band 4
V. Calculate the Reflectance of band 5th by using the same method.
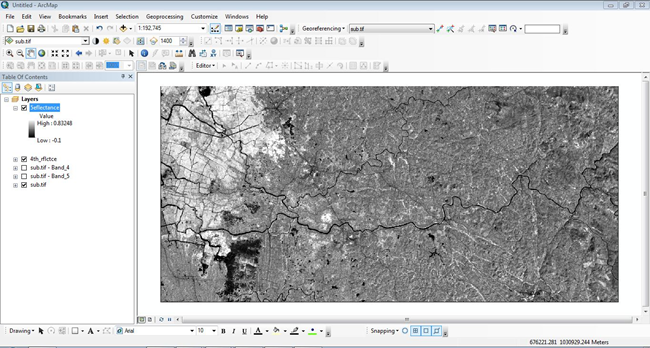
Reflectance calculated for band 5[/vc_column_text][/vc_column][/vc_row][vc_row margintop=”0″ marginbottom=”15″ paddingtop=”0″ paddingbottom=”0″ bg_color=”#ffffff” bg_repeat=”repeat” bg_stretch=”no” en_border=”no” border_color=”#e8e8e8″][vc_column][vc_column_text]
Step 2: Correcting the Reflectance value with sun angle
Reflectance with a correction for the sun angle is then:
[/vc_column_text][/vc_column][/vc_row][vc_row margintop=”0″ marginbottom=”15″ paddingtop=”0″ paddingbottom=”0″ bg_color=”#ffffff” bg_repeat=”repeat” bg_stretch=”no” en_border=”no” border_color=”#e8e8e8″][vc_column width=”1/2″][vc_column_text]
ρλ = ρλ ‘/cos θSZ = ρλ ‘/sin θSE[/vc_column_text][/vc_column][vc_column width=”1/2″][vc_column_text]Where:
ρλ = TOA planetary reflectance
θSE = Local sun elevation angle. The scene center sun elevation angle in degrees is provided in the metadata (Sun Elevation).
θSZ = Local solar zenith angle; θSZ = 90° – θSE.
[/vc_column_text][/vc_column][/vc_row][vc_row margintop=”0″ marginbottom=”15″ paddingtop=”0″ paddingbottom=”0″ bg_color=”#ffffff” bg_repeat=”repeat” bg_stretch=”no” en_border=”no” border_color=”#e8e8e8″][vc_column][vc_column_text]I. Find Sun Elevation from the metadata
Apply and perform the values in Raster calculator for both RED and NIR band reflectance values (4 and 5 bands)
Example
Band 4 corrected_ reflectance= (“4th_rflctnce”) / Sin (49.36816761)
Where:
SUN_ELEVATION = 49.36816761
4th_rflctce =uncorrected reflectance
Set the output folder and file name then click “OK”
[/vc_column_text][/vc_column][/vc_row][vc_row margintop=”0″ marginbottom=”15″ paddingtop=”0″ paddingbottom=”0″ bg_color=”#ffffff” bg_repeat=”repeat” bg_stretch=”no” en_border=”no” border_color=”#e8e8e8″][vc_column][vc_column_text]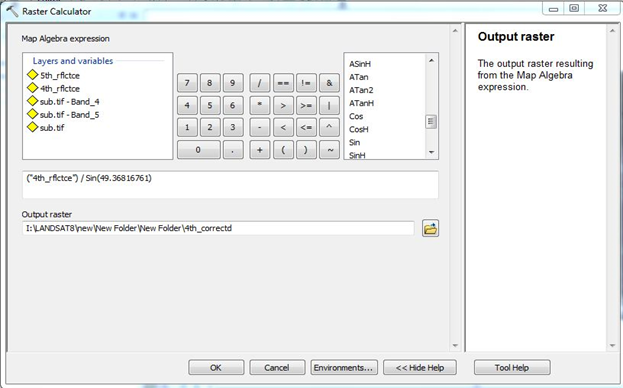
Raster Calculator function to perform sun angle corrected reflectance
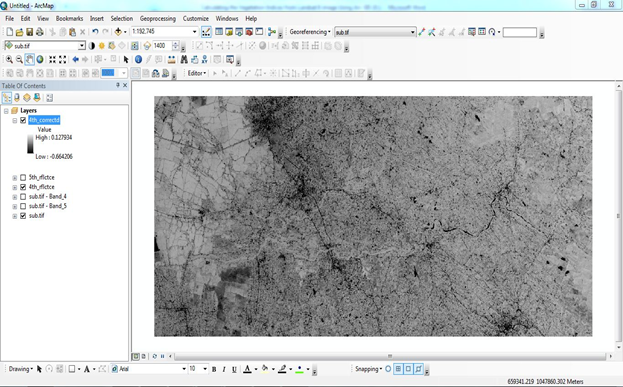
Sun angle corrected reflectance for band 4th[/vc_column_text][/vc_column][/vc_row][vc_row margintop=”0″ marginbottom=”15″ paddingtop=”0″ paddingbottom=”0″ bg_color=”#ffffff” bg_repeat=”repeat” bg_stretch=”no” en_border=”no” border_color=”#e8e8e8″][vc_column][vc_column_text]II. Calculate the Reflectance of band 5th by using the same method
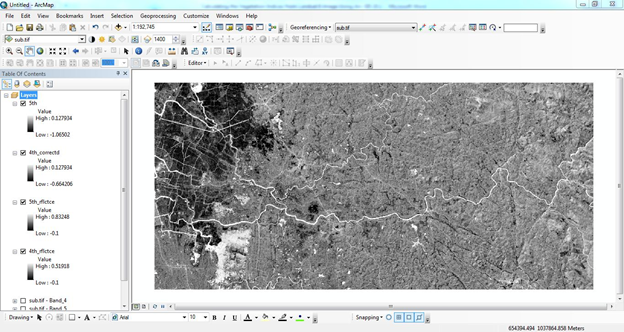
Sun angle corrected reflectance for band 5th[/vc_column_text][/vc_column][/vc_row][vc_row margintop=”0″ marginbottom=”15″ paddingtop=”0″ paddingbottom=”0″ bg_color=”#ffffff” bg_repeat=”repeat” bg_stretch=”no” en_border=”no” border_color=”#e8e8e8″][vc_column][vc_column_text]
Step 3: Calculating NDVI from 4th and 5th bands
As we discussed earlier to find NDVI we use the formula of
Here band 4= RED and band 5=NIR
I. Open Raster calculator and apply this formula and execute the program as follows
NDVI= (Band 5 corrected –Band 4 corrected)/ (Band 5 corrected + Band 4 corrected)
Set the output folder and file name then click “OK”
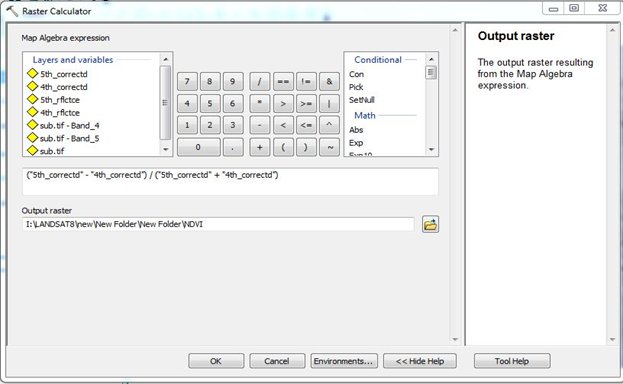
Raster Calculator function to perform NDVI

Normalized Differential Vegetation Index
The value of NDVI is always between 1 and -1[/vc_column_text][/vc_column][/vc_row][vc_row margintop=”0″ marginbottom=”15″ paddingtop=”0″ paddingbottom=”0″ bg_color=”#ffffff” bg_repeat=”repeat” bg_stretch=”no” en_border=”no” border_color=”#e8e8e8″][vc_column][vc_column_text]
Step 4: Calculating SAVI from Reflectance
Soil Adjusted Vegetation Index shows background soil conditions. SAVI is a hybrid between NDVI and PVI (Perpendicular Vegetation Index).
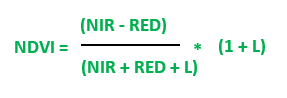
Where NIR is the 5th band and RED is the 4th band respectively. L is the Soil brightness correction factor. The value of L varies by cover of green vegetation. High vegetation areas L= 0; the areas have no green vegetation then L=1. Generally L=0.5 in most causes and it works well. When L=0 then NDVI=SAVI
I. Open Raster calculator and apply this formula and execute the program as follows
SAVI= (Band 5 corrected –Band 4 corrected)/ (Band 5 corrected + Band 4 corrected)*(1+L)

Raster Calculator function to perform SAVI

Soil Adjusted Vegetation Index[/vc_column_text][/vc_column][/vc_row][vc_row margintop=”0″ marginbottom=”15″ paddingtop=”0″ paddingbottom=”0″ bg_color=”#ffffff” bg_repeat=”repeat” bg_stretch=”no” en_border=”no” border_color=”#e8e8e8″][vc_column][vc_column_text]
Step 5: Calculating Tasseled cap indices
Tasseled cap indices give the measure of Greenness, Brightness and Wetness of each pixel and utilize a linear combination of 6 Landsat bands (From 2nd band to 7th band). Tasseled cap indices is calculated by the following equation
Tas_cap ἱ = (coeff₂ * band2) + (coeff₃ * band3) + (coeff₄ * band4) +
(coeff₅ * band5) + (coeff₆* band6) + (coeff₇ * band7)
Where Tas_cap ἱ is the calculated tasseled cap index for brightness, greenness, or wetness from the coefficient given[/vc_column_text][/vc_column][/vc_row][vc_row margintop=”0″ marginbottom=”15″ paddingtop=”0″ paddingbottom=”0″ bg_color=”#ffffff” bg_repeat=”repeat” bg_stretch=”no” en_border=”no” border_color=”#e8e8e8″][vc_column][vc_column_text]
|
Index |
Band (Blue) |
Band (Green) |
Band (Red) |
Band (NIR) |
Band (SWIR |
Band (SWIR |
|
Brightness |
0.3029 |
0.2786 |
0.4733 |
0.5599 |
0.508 |
0.1872 |
|
Greenness |
−0.2941 |
−0.243 |
−0.5424 |
0.7276 |
0.0713 |
−0.1608 |
|
Wetness |
0.1511 |
0.1973 |
0.3283 |
0.3407 |
−0.7117 |
−0.4559 |
Given by Muhammad Hasan Ali Baig et al (2014)
[/vc_column_text][/vc_column][/vc_row][vc_row margintop=”0″ marginbottom=”15″ paddingtop=”0″ paddingbottom=”0″ bg_color=”#ffffff” bg_repeat=”repeat” bg_stretch=”no” en_border=”no” border_color=”#e8e8e8″][vc_column][vc_column_text]
Step 6: Calculating Tasseled cap Brightness indices
I. Calculate the Reflectance of Band 2, 3, 4, 5, 6, 7, using the same method mentioned above (Process 1 and 2)
II. Open Raster calculator and apply the formula for Brightness index and execute the program as follows
Tas_cap ἱ = (0.3029 *(2nd_Band_correted))+
( 0.2786 *(3rd_Band_correted))+
( 0.4733 *(4th_Band_correted))+
( 0.5599 *(5th_Band_correted))+
( 0.508 *(6th_Band_correted))+
( 0.1872 *(7th_Band_correted))
Raster Calculator function to perform SAVI Raster Calculator function to perform SAVI
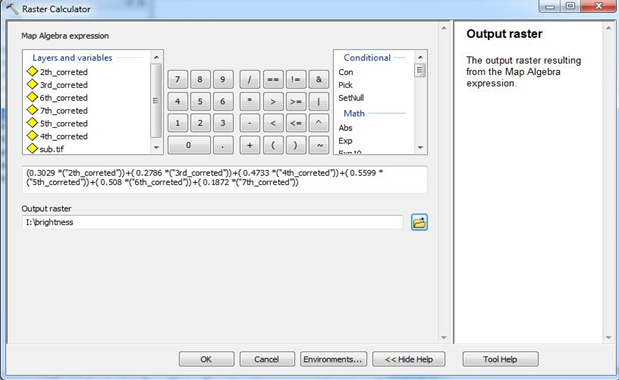
Raster Calculator function to perform Brightness index
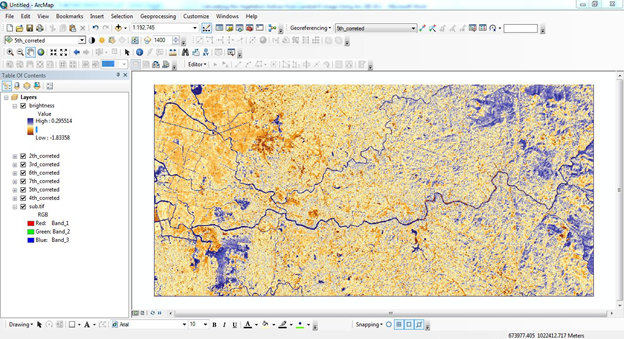
Tasseled cap brightness index[/vc_column_text][/vc_column][/vc_row][vc_row margintop=”0″ marginbottom=”15″ paddingtop=”0″ paddingbottom=”0″ bg_color=”#ffffff” bg_repeat=”repeat” bg_stretch=”no” en_border=”no” border_color=”#e8e8e8″][vc_column][vc_column_text]
Step 7: Similarly calculate the other indices using the same method mentioned above
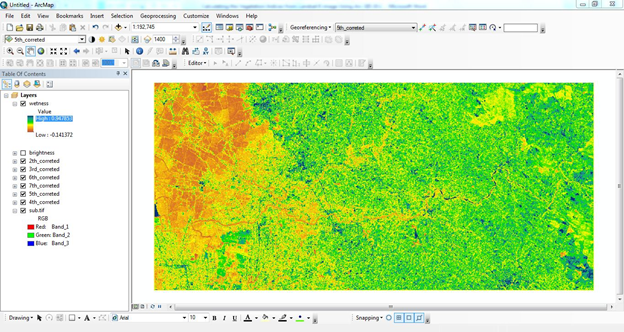
Tasseled cap wetness index

Tasseled cap Greenness index[/vc_column_text][/vc_column][/vc_row][vc_row margintop=”30″ marginbottom=”15″ paddingtop=”0″ paddingbottom=”0″ bg_color=”#ffffff” bg_repeat=”repeat” bg_stretch=”no” en_border=”no” border_color=”#e8e8e8″][vc_column][vc_column_text]References:
http://landsat.gsfc.nasa.gov/?p=3186
http://hydrology1.nmsu.edu/teaching/soil698/greenseeker/what_is_ndvi.htm
http://www.pvts.net/pdfs/ndvi/3_3_ndvi.PDF
Muhammad Hasan Ali Baigab, Lifu Zhanga, Tong Shuaiab & Qingxi
Tonga- “Derivation of a tasselled cap transformation based on Landsat 8 atsatellite reflectance” (2014) Remote Sensing Letters
http://www.tandfonline.com/loi/trsl20
Grant J. Firl, Lane Carter” Calculating Vegetation Indices from Landsat 5 TM and Landsat 7 ETM+ Data”(2011)[/vc_column_text][/vc_column][/vc_row][vc_row margintop=”30″ marginbottom=”15″ paddingtop=”0″ paddingbottom=”0″ bg_color=”#ffffff” bg_repeat=”repeat” bg_stretch=”no” en_border=”no” border_color=”#e8e8e8″][vc_column][tagline_box call_text=”NOW READ:” call_text_small=”Know Basics of Remote Sensing Quickly and Become Expert” title=”READ” color=”blue” margin=”0″ href=”http://grindgis.com/what-is-remote-sensing/know-basics-of-remote-sensing”][/vc_column][/vc_row]


Hamid
20 Nov 2015hi Mate
Thank you very much for your useful information about NDVI, I have a question:
I download Landsat 8 images from USGS, mostly surface reflectance and in some case NDVI data, I want to change the resolution of NDVI to 15m, I do with resampling in Arcgis, it does and you get the 15m, but for presentation purpose on screen the sell size remain 30 m,also I did raster to point from my NDVI and then with interpolation I made 15m sell size. but this process may slightly change the NDVI data.
can I apply pan sharpening process on NDVI which is one band image? I would appreciate if you consider my questions.
kind regards
Hamid
admin
23 Nov 2015I will try to find answer for you, thank you for your comment
Eliziele
23 Feb 2016Excellent article ! Congrats !
admin
23 Feb 2016Thank you
Swapnil
6 Mar 2016Hello Sir…
I have calculated NDVI and SAVI for landsat-8 image as you given. But Iam getting higher value of NDVI than SAVI
Can you tell me reason for this
NDVI=0.46
SAVI=0.34
Specific band values are
toa b4- 0.130
toa b5- 0.3650
Bang
4 Apr 2016Hey, you’ve a mistake with corrected reflectance
AL = Band-specific additive rescaling factor from the metadata (RADIANCE_ADD_BAND_x
http://landsat.usgs.gov/Landsat8_Using_Product.php
admin
6 Apr 2016Thanks I will go through it and amend it, Appreciate for that.
ramin
12 Jul 2016very good your website, thank you
admin
12 Jul 2016Thank you
vkunkel
19 Jul 2016Hi,
Shouldn’t you convert the angle to radians?
I thought that ArcGIS prefers to work in radians.
Also, woking with trig also requires setting the cell size and extent in the ArcGIS geoprocessing environment, something I learnt the hard way.
admin
19 Jul 2016Yes you have to convert to radians in Arcgis, good info.
vkunkel
20 Jul 2016So just use:
(“4th_rflctce”) / 0.75890963 OR (“4th_rflctce”) / Sin(49.36816761 * math.pi / 180)
in the raster calculator step 1, agreed?
rita
6 Aug 2016please how do you convert to radians and what do you set the cell side and extent to? please I would appreciate an immediate reply. thank you
rasoni
8 Aug 2016can you upload the tutorial for enhanced difference vegetation index, generalized difference vegetation index, normalized difference water index, specific leaf area vegetation index, and simple ratio.
Ru
29 Aug 2016I have tried these steps several times using radian and degree as well,but I am getting NDVI more than +1 to -1..It is showing NDVI values from 549 to -99..How is this possible??
rasoni
21 Oct 2016i have also same problem.. why??
Xudong Zhang
25 Sep 2016Thank you so much. Your post gave me an easy and clear way to calculate NDVI. But I have some questions confused me a long time.
In http://earthexplorer.usgs.gov/ website, there are two different directories “L8 OLI/TIRS” and “Landsat Surface Reflectance – L8 OLI/TIRS”, what’s the difference between them? It seem that your method is used the former data. How I can calculate NDVI use the later data?
For the same pixel, the DN values of them are not identical. Could you give me some explanation for this?
For an example, LC80420352015194LGN00 :
cfmask 0
cfmask_conf 1
B1 10267 sr_band1 194
B2 9326 sr_band2 259
B3 8666 sr_band3 486
B4 7922 sr_band4 452
B5 19322 sr_band5 3123
B6 13520 sr_band6 1928
B7 9597 sr_band7 1102
B8 8321 sr_cloud 16
B9 5062
B10 29159
B11 26862
BQA 20512
Thanks again.
Iqbal
2 Nov 2016For the first step :
1. Calculating Reflectance value from the Satellite data
The formula is like this Lλ = MLQcal + AL or ρλ’ = M ρQ cal + A ρ
where:
Lλ = TOA spectral radiance (Watts/( m2 * srad * μm))
ML = Band-specific multiplicative rescaling factor from the metadata (RADIANCE_MULT_BAND_x, where x is the band number)
AL = Band-specific additive rescaling factor from the metadata (RADIANCE_ADD_BAND_x, where x is the band number)
Qcal = Quantized and calibrated standard product pixel values (DN
so in the map algebra :
(1.0050E-02*(“LC81190652016289LGN00_B4.TIF”))+-50.24808
because I cant do it for first step. Please help…
Iqbal
10 Nov 2016I cant run for the formula greenness and wetness and there is an error for the formulation I use as below:
Greenness
– 0.2941 *(band2corrected.img)- 0.243 *(band3corrected.img)- 0.5424 *(band4corrected.img)+(0.7276 *(band5corrected.img))+(0.0713 *(band6corrected.img))- 0.1608 *(band7corrected.img)
Wetness
(0.1511 *(band2corrected.img))+ (0.1973 *(band3corrected.img))+(0.3283 *(band4corrected.img))+(0.3407 *(band5corrected.img))+(−0.7117 *(band6corrected.img))+(−0.4559 *(band7corrected.img))
please give me some suggestion
elhilali soufyane
19 Nov 2016Please can you tell me how can i calculate Aerosol optical depth using landsat_8 data ?
thank you so much, anything would be helpful and apreciated
L ARUN
6 Dec 2016hi everyone, please tell me .1 “why we are using calculate only PM10 using landsat 8 images,why cant other(03,N02,CO2 CONCENTRATION) ?”, and also 2 “how we are calculate PM10 using landsat 8 (images, DN values and MTL files ) briefly ?”
thanks in advance .
Kirsten
14 Dec 2016Hello, Thank you for this very good explination!
I am also using Landsat 7 data for NDVI calculation and was wondering whether to do the same steps as for Landsat 8 (step 1 & 2 for correction, and then step 3 for NDVI but with band 3+4 instead of 4+5).
If this is so, where do I find Reflectance_Mult_Band_x and Reflectance_Add_Band_x for Landsat 7?
admin
14 Dec 2016Thank you, please see on this tutorial, http://ibis.colostate.edu/WebContent/WS/ColoradoView/TutorialsDownloads/CO_RS_Tutorial10.pdf
Zaheer
22 Dec 2016How can we Calculate the file size (in bit) of the Landsat 8 OLI file assuming that only the information for each pixel are stored within the image
johnie
6 May 2017i just read this, it is really helpful and systematically outlined, bravo to the author.
admin
6 May 2017Thank you Johnie
Momchill
17 May 2017Hi, congrats on the blog and the guide. I just have one question – aren’t TOA reflectance values supposed to be converted to BOA (bottom of the atmosphere) reflectance through Dark Object Subtraction, or any other method, in order to remove the atmospheric signal. As far as I know, this should be done before any kind of analysis involving indexes or classification is concerned.
admin
19 May 2017I will see and reply to you.
ChinZ
29 May 2017I have done the same as you have shown, but I’m getting very higher level NDVI data why is it so ? The data is L8 OLI/TIRS
Ahmad Shah
2 Jun 2017Sir.
how can i retrieve LAI leaf area index using NDVI and SAVI?
Sathya
19 Jun 2017Sir,
Thank you for the guide & it was very helpful to me. As well as I need to know about the cloud correction for Landsat8, Landsat7 & Landsat5.
Thank You!
اغانى 2018
20 Oct 2017I liked it.
admin
1 Nov 2017Thank you,
M
18 Mar 2018Hi,
Thank you for this post. I hope you’re still active.
The maximum NDVI value I get is 1.51 do you know how I can correct this? Or what might have gone wrong?
Jobyda Sultana
28 Jan 2020how can i calculate Enhanced Vegetation Index for Landsat 1-3 image and Landsat 8 image? and how can i normalize the range of EVI value as it is not a normalized index using ArcGIS 10.1?
Chevdumoi
27 Apr 2021Without any cultivation activity, will the NDVI values be the same for two fields that are not contagious? The two fields have about 1 Deg difference.