TileMill is used to create beautiful map for journalist, web designer, researcher, or seasoned cartographer. It is a design studio where you create stunning maps. Following are the features of TIleMill.
|
- Downloading the TileMill
- Opening the Maps in TileMill
- Loading the Data in the TileMill
- Changing Map Style
- Exporting the Map
- Uploading to Mapbox
- Final look of the Map
First step is to download the Software.
Downloading the TileMill
1.Go to the Mapbox website to download the TileMill. Download

2. Then run the setup wizard by clicking the downloaded file TileMill-v0.10.1-Setup.exe
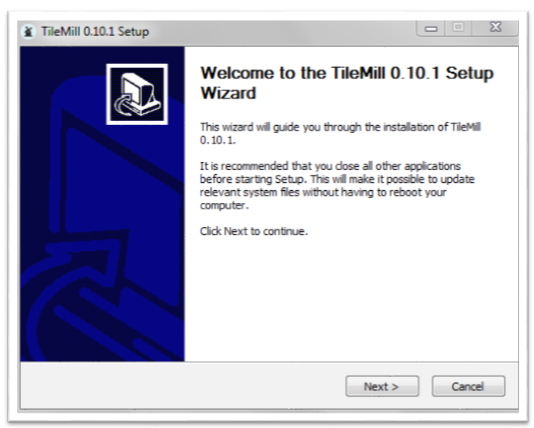
3.Then press Next and Next and then Install.
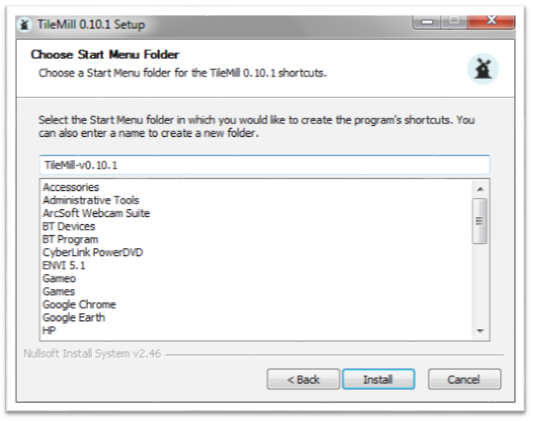
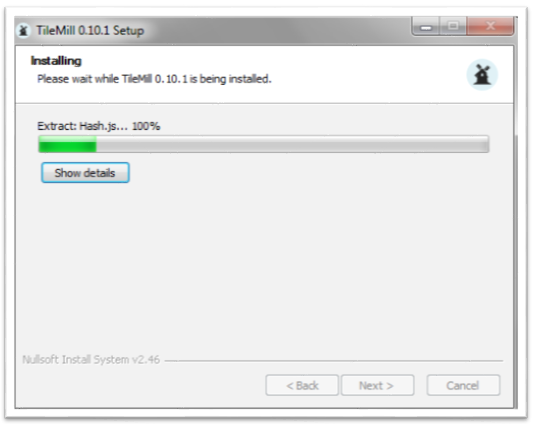
4.The TileMill will run for a while to install the required files, at the end click finish to finish the installation process.
Opening the Maps in TileMill
5.Then open the TileMill from the start > All Program Files >TIleMile-v0.10.1

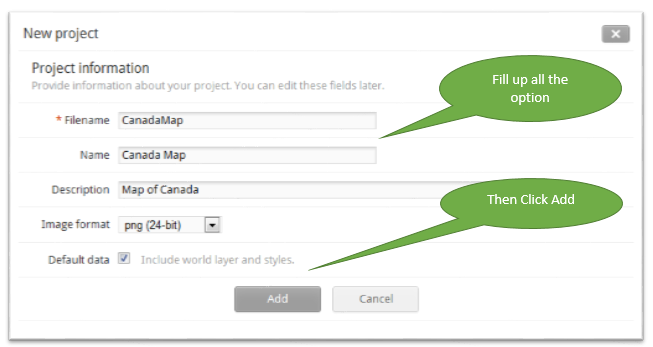
6. Click on the New Project button to create a fresh project, and then fill up all required option. Finally click Add which will create a new project on the window.
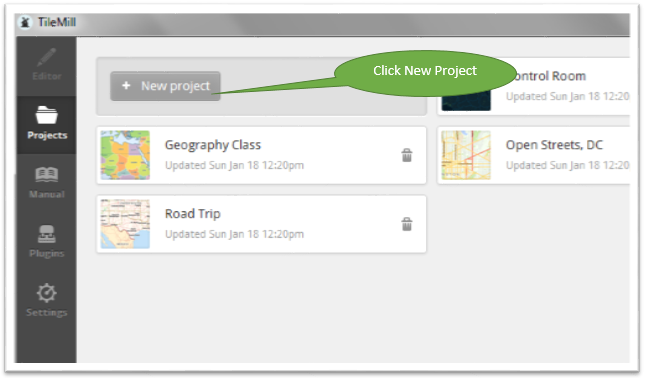
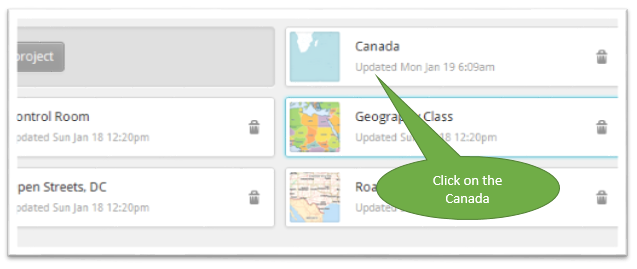
7. Click newly created Project icon which will take you to the new window.
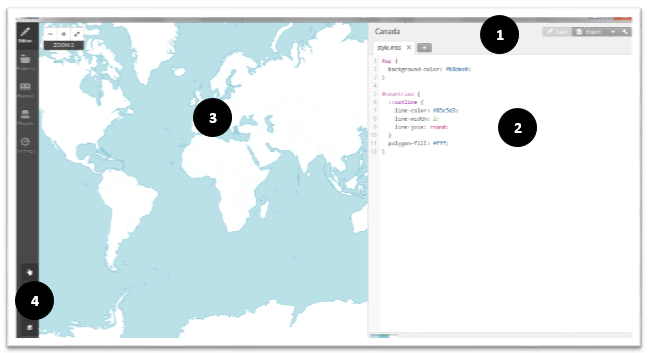
8. Map will open with all the TileMill option. Have a look at all the option on the below image.
- Main Toolbar
- Style Sheet Editor
- Preview map
- Style Sheet Editor
Loading the Data in the TileMill
9. Please download the Canada Shapefiles (Edited, not responsible for errors): TillMill.rar
Or
Go to Canada official website, all the data are from here: http://geogratis.gc.ca/geogratis/DownloadDirectory
10. Click on the Layers and then on Add Layer to import Canadian Shapefiles. In GIS it is the rule you can say, bottom layer is always Polygon followed by Polyline and on the top point file. So add all the layers, starting
with the polygon. By default a map of the world exist.
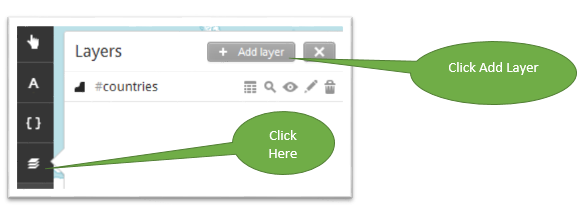
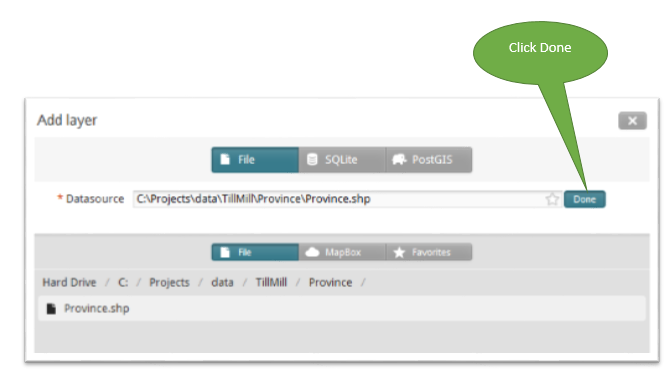
11. Click on the browse button to add the layers.
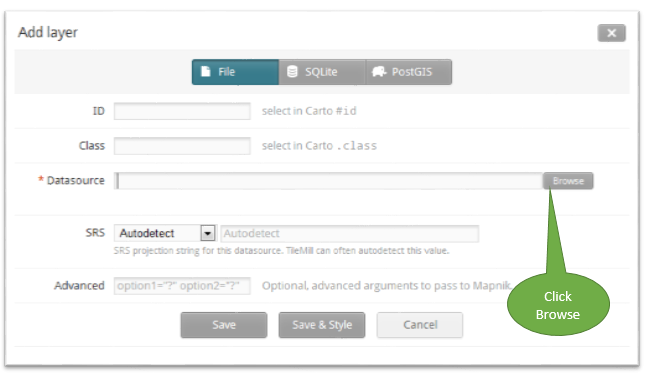
12. Browse the Province.shp, select and press Done.
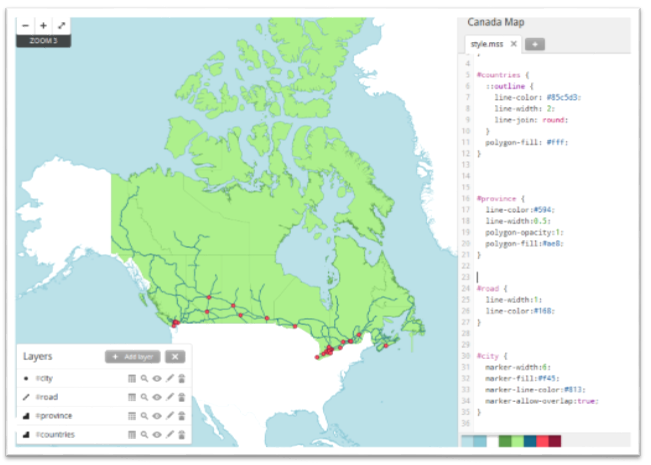
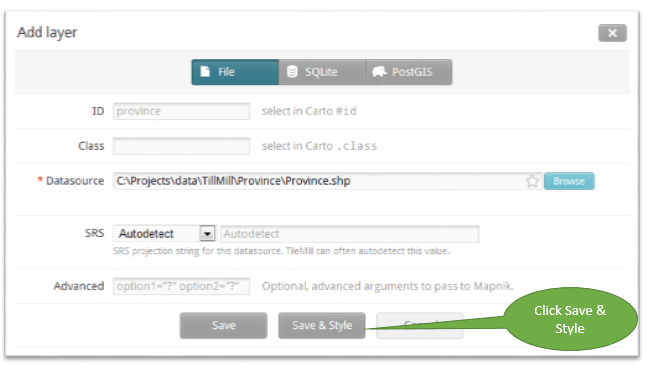
13. Add layer window will prompt back, then Click Save & Style. Province map will be added to the map window with the new style. In the same way, please add road.shp and city.shp. As said earlier next layer will be road and the last one will be the city layer. See below image.
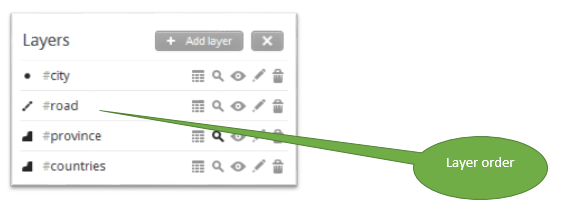
Layer fashion should be this way.
14. Final map look will be as below. In your case map color might be different. Next step is to change the map color.
Changing Map Style.
15. First please read the tutorial about the TillMill style and TillMill Crash Course. In our case we are using three layers and each of the layer has its own style. To change the color of any of this layers, you select the color from the color pallet (or you can type the color code on the style editor). Each color displaying in the bottom color pallet is for the individual layer. Do not pick the wrong color pallet.
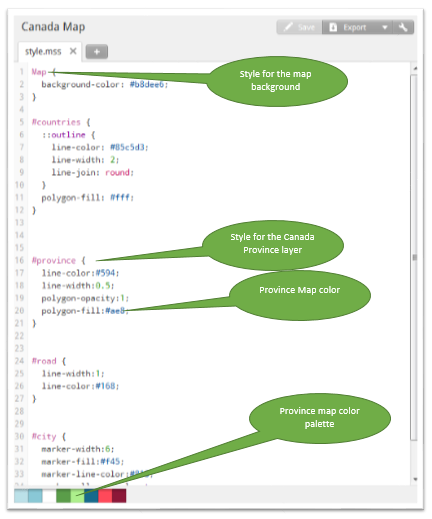
16. Now let us change the color of the map to have better look. Just change the code which are bold and blue color.
|
Layer Name |
Style |
Change To |
|
Countries |
#countries {::outline {line-color: #85c5d3;line-width: 2;line-join: round;}polygon-fill: #fff;
}
|
#countries { ::outline { line-color: #9cb2b6; line-width: 1; line-join: round; } polygon-fill: #d8d4d4; } |
|
Province |
#province { line-color:#594; line-width:0.5; polygon-opacity:1; polygon-fill:#ae8; } |
#province { line-color:#666965; line-width:1; polygon-opacity:0.75; polygon-fill:#edd987; } |
|
Road |
#road { line-width:1; line-color:#168; } |
#road { line-width:2; line-color:#411e02; } |
|
City |
#city { marker-width:6; marker-fill:#f45; marker-line-color:#813; marker-allow-overlap:true; } |
#city { marker-width:8; marker-fill:#ee3010; marker-line-color:#6c0321; marker-allow-overlap:true; } |
17. Labelling the Province layer is done by adding the below code to the style. Add the label below the province layer style so the font does not label under the province layer, Read this for the layer labeling
|
Layer Name |
Style |
Change To |
|
Province |
#province { line-color:#666965; line-width:1; polygon-opacity:0.75; polygon-fill:#edd987; } |
#province { ::shape{ line-color:#666965; line-width:1; polygon-opacity:0.75; polygon-fill:#edd987; } ::label { text-name: [PROV_TERR]; text-face-name: ‘Angsana New Regular’; text-fill: #282727; text-size: 20; text-halo-fill: fadeout(black, 30%); text-halo-radius: 1;
} } |
18. For Labelling the City layer add the new style tab by clicking add button and type the name Label, after that click save button. This will add Label CSS style tab.

19. Add the following code on the Label style tab. Read Advance Label Placement technique in TileMill.

|
Code |
Explanation |
|
Zoom >4 |
Label will be labelled after zoom level 5 |
|
Text – name: |
Field name to be labelled |
|
Text – fill |
Label color |
|
Text – size |
Font size |
|
Text – halo – fill |
Will add halo color around the text |
|
Text – halo – radius |
Size of the halo |
|
Text – placements |
The priority queue for the label position and number |
|
Text –dy, text- dx |
How far away the label should be placed, size in |
Final Code for the style sheet.
|
Style.mss |
Label |
|
Map { background-color: #b8dee6; }
#countries { ::outline { line-color: #9cb2b6; line-width: 1; line-join: round; } polygon-fill: #d8d4d4; }
#province { ::shape{ line-color:#666965; line-width:1; polygon-opacity:0.75; polygon-fill:#edd987; } ::label { text-name: [PROV_TERR]; text-face-name: ‘Angsana New Regular’; text-fill: #282727; text-size: 20; text-halo-fill: fadeout(black, 30%); text-halo-radius: 1; } }
#road { line-width:2; line-color:#411e02; }
#city { marker-width:8; marker-fill:#ee3010; marker-line-color:#6c0321; marker-allow-overlap:true;
}
|
#city [zoom>4] { text-name: [NAME_EN]; text-face-name: ‘Angsana New Regular’; text-fill: #036; text-size: 20; text-halo-fill: fadeout(#b6bac0, 30%); text-halo-radius: 2.5; text-placements: text-dy: 5; text-dx: 5; } |
20. Next step is to add the legend, click on the legend icon. The legend uses Unicode box-drawing characters to approximate the line styles.

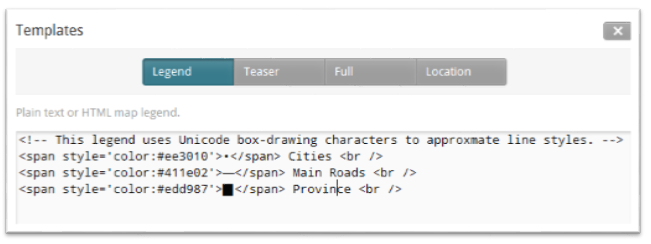
Real code:
|
<span style=’color:#ee3010′>•</span> <span style=’color:#411e02′>━</span> <span style=’color:#edd987′>▉</span> |
Exporting the Map
TillMill can export map in different format such as MBTiles formats, PNG, PDF, SVG or Mapnik XML. But to make it interactive we will be exporting to MBTiles format.
21. Click on the export icon and then click on the MBtiles.

22. Then shift and drag the map to adjust the loading view. We want just the Canada boundary to show when the map load. See the below image. And also click on the center of the Canada map to get the center coordinate, so map will zoom and center on that coordinate.

23. Assign the filename, also adjust the zoom level. Higher the zoom level bigger will be the file size. Finally click on Export button.
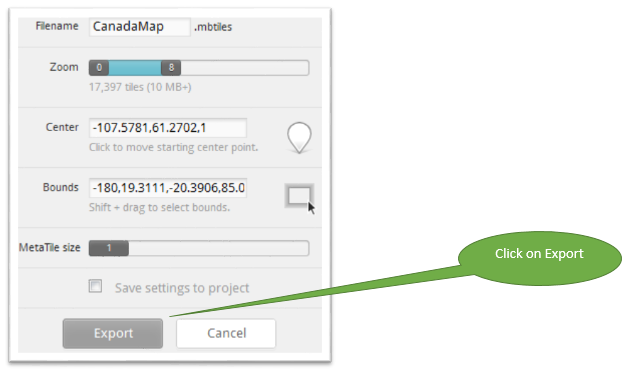
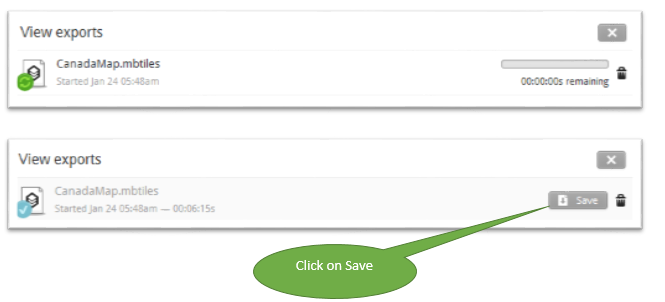
24. Map will start to export, once the process is done then click on save button to save the map on local drive.
Uploading to Mapbox
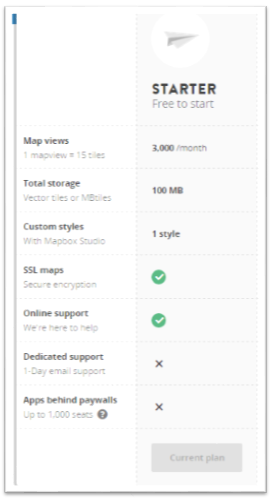
Open the free account with the mapbox. Every month you get 3000 map views per month and 100 mb of storage.
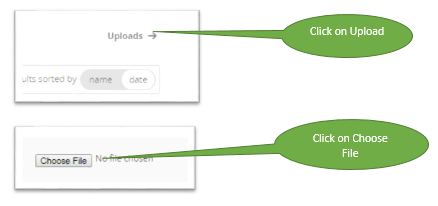
25. Click on Data and then followed by upload. Finally click on Choose file to upload mbtiles file from local drive to mapbox.

26. It will take few minutes to upload the file which totally depend on the file size.

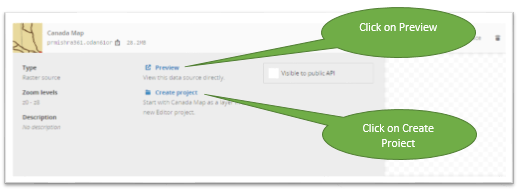
27. Once the data is uploaded, it’s information will be displayed as shown in the below image. Click on preview button to see the map. Then click on create project.
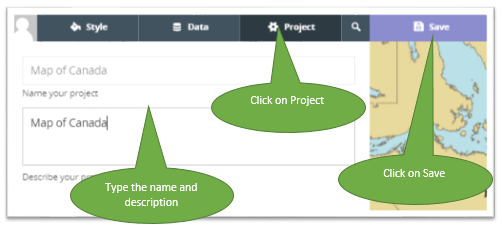
28. Once the project is created, next process is to assign the name. For that click on Project, type the name and description and finally click on the save button to save the information. You have the option of picking up the
styles, adding the data and more.
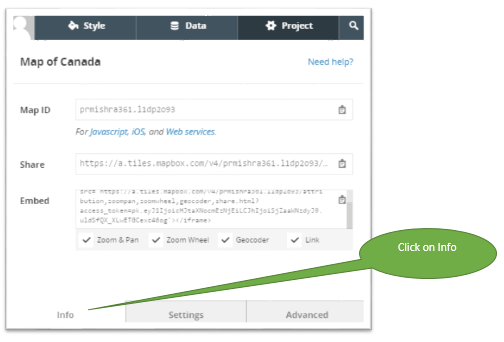
29. Click on Info button to copy the html code to embed on the website.
Final look of the Map

