Merriam – Webster dictionary defines a map in three ways, the first, “a representation usually on a flat surface of the whole or a part of an area” second, “a representation of the celestial sphere or a part of it,” and third, ” a diagram or other visual representation that shows the relative position of the parts of something”
The word ‘map’ comes from a Latin word, ‘Mappa Mundi’ which had two meanings, Mappa, meaning cloth or sheet, and Mundi, meaning ‘world’ The literal translation of ‘Mappa Mundi’ was. “sheet of the world.” The word ‘map’ is a shortened derivative that means a two-dimensional representation of the earth’s surface.
A map is a symbolic depiction of different objects, regions, themes, features and the like. Most Maps are static, meaning they are fixed on paper. Technology has made most maps interactive. You can manipulate and use them to scour for different information.
Maps are mostly geographical depiction of physical features. They can also be used to represent nonphysical information, like DNA and brain mapping. Spaces being mapped can be two dimensional e.g the earth’s surface or three dimensional like in the earth’s crust.
Physical maps show the earth’s features, like landscapes, mountains, rivers, valleys, deserts, lakes and oceans. They can also be used to show elevation, land use, infrastructure, and many other man-made features. Physical maps that show boundaries are also known as political maps.
Modern maps apply GIS (Geographic Information Systems) used in industries as diverse as agriculture, Disaster management, disease control and many more. The effectiveness of GIS maps is based on Algorithms, Satellite sensing, and Machine learning, to capture analyze and integrate georeferenced and geospatial data.
The intergovernmental committee on surveying and mapping identifies five categories of physical maps;
1. Topographical,
2. Thematic,
3. Navigation Charts and
4. Cadastral Maps and Plans.
5. General Reference
Maps run the affairs of the world. In this article we will look at diverse uses and applications of maps in daily life;
1. Road map

Source: http://ontheworldmap.com/usa/usa-road-map.html
Road Maps or route maps are the commonest used physical maps, A road map is navigational map that displays roads and transport links, they show boundaries and other physical features like schools hospitals, forests, famous landmarks, recreational facilities, hotels and restaurants, train stations, airports and many other important features that help the user identify where they are.
2. Aeronautical Maps
Source: https://www.aopa.org/news-and-media/all-news/2017/november/16/new-faa-chart-users-guide-published
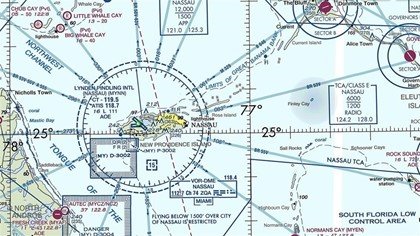
Aeronautical maps or aeronautical charts as they are commonly referred to, are navigational physical maps used by pilots when flying. There are two types of aeronautical maps, earth landmass maps, and transoceanic travel maps, they can be used as visual flight charts used according to scale and how much information a pilot would like to see.
Aeronautical Maps help pilots to determine their position relative to their destination, they have safe navigational tools like altitude alternative landing sites in case of emergencies, radio frequencies, and airspace boundaries.
3. Nautical Maps/Charts
Nautical Maps or charts are navigational physical maps. They come in two forms, printed charts and computerized electronic navigational charts. They are used by sailors and ship captains to navigate seas oceans and lakes.
In addition to showing location, they show a graphic representation of the water area, the shoreline, the depth of water, and other details like the sea bed, navigational hazards, tidal and currents, information about harbors, buildings and bridges, etc. Nautical charts can now be printed on demand meaning that they show the most current information.
4. Railroad maps
Source: https://www.mapsofworld.com/usa/usa-rail-map.html
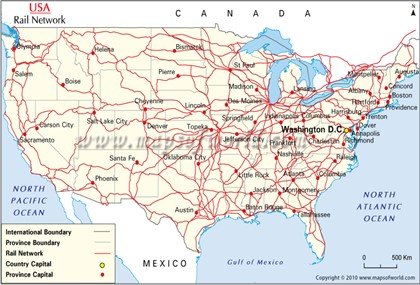
Railroad maps are physical maps used to show all rail permanent structures, which consist of the railway and railroad tracks, subway tracks, tram cars, and cable cars, they also show railway stations, subway stations in different locations.
5. Trail maps
Source: http://circuitsfrontieres.com/en/trail-maps/
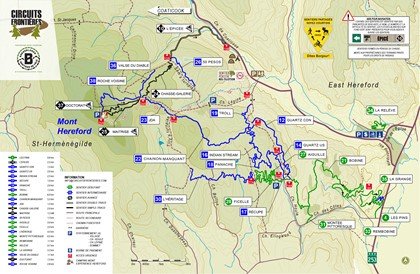
Trails maps are route maps used by bikers and hikers to find, identify trails along rivers, forests, uninhabited land, along highways and wild territory. Trail maps can be used by walkers, cyclists, off-road vehicles, skiers, cattle, etc.
6. Utility maps

Utility maps are physical maps that show utility lines and pipeline networks. They show power lines, and electricity grids, cable networks, water mains supply pipeline, petroleum pipelines, and natural gas pipelines.
7. Assessor’s Maps
Assessor’s tax maps are physical maps compiled from recorded subdivisions, plans and individual parcels that show inventory and ownership of land in towns, municipalities, and cities. They approximate the geometric size of land parcels. They are public records updated regularly and are accessible by the public.
8. Emergency services providers Maps
Emergency services providers’ maps are physical maps that show locations of emergency providers, hospitals, fire stations, etc. They are extremely important in underdeveloped regions and sparsely populated geographical locations.
9. Natural Disasters Maps
Source: https://www.dw.com/en/risk-index-maps-worlds-disaster-hot-spots/a-15160415
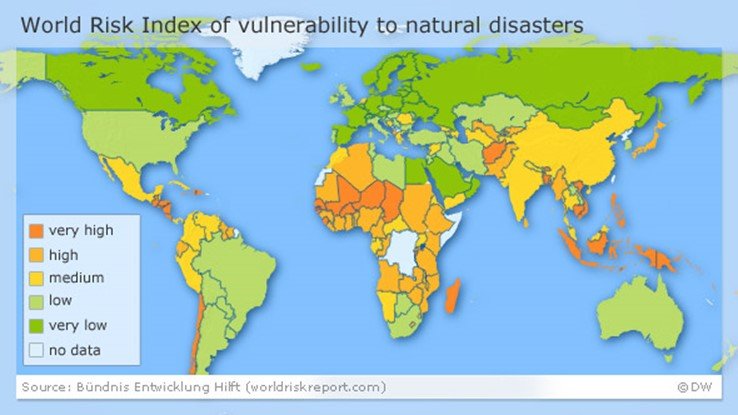
Natural Disasters maps are GIS physical maps that use imagery and satellite maps that record and interpret natural disasters like hurricanes, typhoons, tornadoes, and cyclones, affecting different geographical zones. They are used by disaster response personnel, planners and operators to assess vulnerability and to prioritize mitigation and preparedness activities.
10. Rainfall level maps
Rainfall level maps are climatic physical maps updated daily accessed from the national climatic database, that show detailed rain patterns, forecasts, rivers, lakes, swamps and physical features impacted by rainfall. They are easy to understand maps that show the changing amount of precipitation over time.
11. Agricultural Activities maps,
Agricultural activities maps are GIS integrated that integrate multispectral imagery collected by satellite aircraft unmanned aerial vehicles, that show agricultural production and crop status information that helps FAO to improve the world’s agricultural resources, especially in developing countries. They show crop quality quantity and location including vegetation crop stress and soil indices. Farmers can use these maps on Google maps to carry out closer analysis of crop management, in irrigation fertilization and pest control.
12. Nature Maps
Nature maps are physical maps that show plant and wildlife distribution and geographical region. It shows species distribution performance, wildlife management, community impact, and human activities.
13. Demographic data map
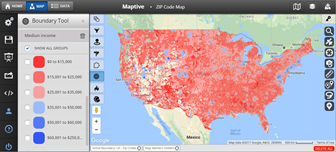
Source: https://www.maptive.com/feature/demographic-overlays/
Demographic maps are GIS mapping that shows the world’s population densities in specific areas, they can be used to monitor the distribution of important facilities like hospitals, transportation networks and the like.
14. Health maps
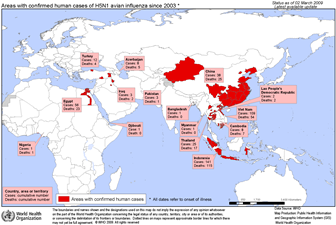
Source: https://researchguides.library.wisc.edu/c.php?g=177749&p=1170229
Health maps are physical maps for infectious diseases published by CDC (center for disease control) that are compiled out of online news aggregators, eyewitness reports expert advice and other sources, to monitor disease outbreak. They map out deaths, new infections, and confirmed cases of infectious diseases.
15. Humanitarian Aid maps
Humanitarian aid maps, are published by UNOSAT rapid mapping service to help the humanitarian community, assess humanitarian crises resulting from natural disasters via GIS. The maps can also help present information such as water supply, sanitation and environmental impact in refugee and IDP camps.
16. Wildlife conservation Maps
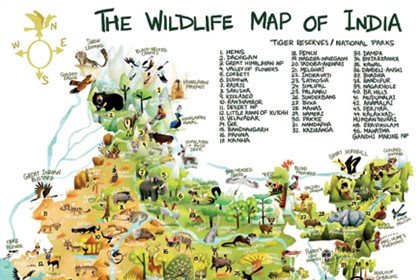
Source: https://www.mid-day.com/articles/mapping-wild-india/16589183
Wildlife conservation maps are used by organizations and communities needed to protect and governments. The maps help monitor population size and to protect the ecosystem. They combine GIS maps for habitat and vegetation and coastal mapping to monitor and analyze conservation activities.
17. Habitat Maps
Habitat Maps are used to foster active conservation for threatened species whose habitat is under threat, for example, the mountain gorillas of Rwanda and the Democratic Republic of Congo and Uganda, GIS maps help to monitor forest cover and human activities including rate and patterns of deforestation in and around protected areas.
18. Environmental Management Maps
Environmental management Maps are GIS maps that are used in integration analysis modeling and monitoring of population growth in countries, changes in landscapes, and other geospatial data for planning, disaster response agricultural diversity forest conservation urban growth and transportation development impact in affected areas.
19. Engineering and Construction Maps
Engineering and construction maps show accurate assessment for construction or engineering project e.g airstrips bridges dams power plants, sewers canal storm utilities industrial parks, etc. They are GIS maps that use GIS and GPS in feature extraction and manipulation to provide accurate georeferenced satellite image data.
20. World Military Maps
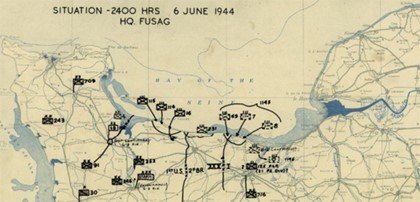
Source: googlemapsmania.blogspot.com
Defense security mapping enable governments to assess and develop better programs that protect property, and enhance the future economic stability of their communities, Security threats range from terrorism, information attacks critical infrastructure, and potential use of mass destruction weapons.
.
21. Homeland Security Maps
Homeland security maps are GIS maps that make use of orthorectified topographic base maps to assess security risks and model emergency scenarios. This is critical because it enables managers, supervisors, and emergency personnel to integrate different information types into a common visual application. Homeland security maps give detailed information on terrain and other key factors important to military operations, like strategic tactical operations, route planning, training and simulations, air-sea and land navigations, etc.
22. Crime Maps
Source: caliper.com
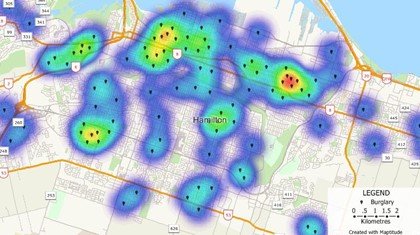
Crime maps display important information about criminal activities happening around the nation and the world. They are GIS maps with high-resolution satellite imagery that show crime hot spots criminal trends and patterns important for fighting crime.
23. Media and Film Maps
Media and film maps are maps of hidden catacombs quarries, a mushroom of tunnels in various cities that have been in existence for hundreds of years. They are used by various media and entertainment industries when shooting historical programs.
24. Tourism Maps
Next to road/ route maps, this is the most commonly used maps, they are GIS maps that show tourism-related data imagery in 3D to help promote leisure and tourism activities.
25. Water map
Source: waterandclimatechange.eu
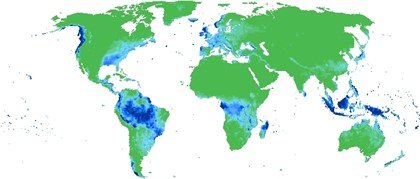
Water maps are geological survey maps that show water resources and sites in a geographical location they help users to identify surface water, lakes streams and rivers, groundwater springs and wells, by location name site number, territory, and region
26. Ground Water map
Groundwater maps are a more detailed representation of local groundwater in a region they are used to monitor groundwater information from thousands of water wells both in the US, Alaska Puerto Rico Hawaii, etc.
27. World Aquifer maps
Source: pinterest.ca
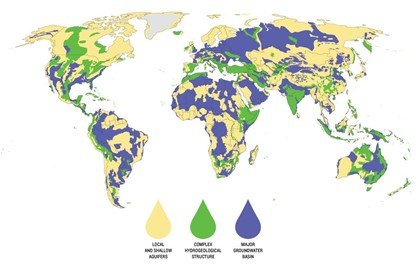
The international groundwater resources center has compiled interactive maps that show thousands of aquifer recharge from over 50 countries. The map includes the water source and final use shown alongside layers of climatic zones groundwater vulnerability, drought hazards, etc.
28. Earth Fissures maps
Earth fissures are associated with basin subsidence and accompany groundwater mining, they vary greatly in physical appearance and maybe more than a mile long, they are a conduit of water runoff that provides water to basin aquifers Interactive Maps of earth fissures help geologists and water miners know their locations.
29. Post Fire Debris Flow maps
Post-fire debris flow maps recorded fires across the united states and the debris flow hazard that accompany these fires, the information provided on the interactive maps allow users to view fires by location and assess debris-flow probability in an area, the maps are historical and date back to 2013.
30. Coasts and Oceans Flow maps

Source: ces.fau.edu
National Oceanic and atmospheric administration compile coats and ocean current flow maps that show detailed marine weather for beaches, coastal waters, offshore waters, and high seas areas, sea surface temperatures, water currents, speed, level, and temperature for the Great Lakes, estuaries, coastal waters, and global oceans.
31. Real-time Flood maps
Real-time flood maps provide information on stream flows, lake levels rivers, rainfall patterns downstream flows lake water levels, heavy rain rains that may cause a risk to flooding
32. Coastal geoscience maps
Source: geoscan.nrcan.gc.ca
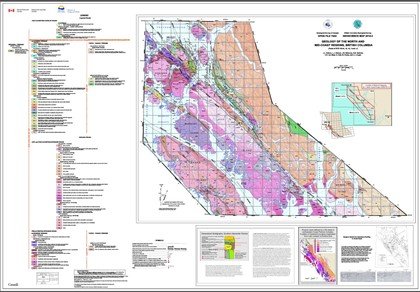
Coastal geoscience maps show information about fish habitats, amphibians, reptiles, shellfish, submerged aquatic vegetation, bathymetric data reefs, coastal lines, and coastal vegetation, like mangrove swamps, etc. They are used to show coastal resilience and sea-level rise vulnerability, storm surge predictions, rate of shoreline change blue infrastructure ranks hydrology, watersheds.
33. Hazardous waste cleanups maps
Source: grist.org
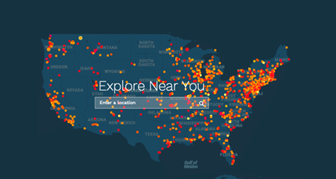
The Interactive map of hazardous waste cleanups across the US provides information on cleanup activities of hazardous waste from contaminated land, this information can be relayed together with information about toxic releases federal lands, air pollution, etc.
34. Stormwater information maps
Stormwater interactive maps provide information on stormwater and include regulated municipal sewer systems combined sewer flow, streams estuaries and lakes and rainfall records.
35. Interactive Spills maps
Source: nucloud.com
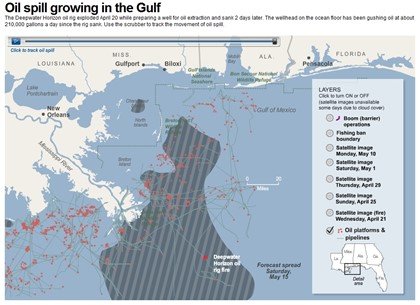
Interactive spills maps show reported spill hazards, of harmful material like oil gasoline, pesticides solvents acids and other industrial chemicals, the maps go to as far back as 1970 and include information about material location date of the spill, storage tanks and facilities with potentially hazardous chemicals.
36. Geothermal resources maps
Geothermal resource maps are interactive maps that provide a huge amount of information about geothermal energy used by geothermal prospectors. The information includes known geothermal resource areas and exploration regions, the geothermal potential for enhanced geothermal systems, identified hydrothermal sites, hot springs, and well analysis geothermal infrastructure, etc.
They also include information about. Volcanoes, Phanerozoic metamorphism, major lakes and rivers, political and administrative boundaries, and many environmental features groundwater, wastewater, cooling tower blowdown, wilderness areas, etc.
37. Bioenergy potential maps
Bioenergy maps show how much biomass is available for bioenergy production in the next 20 years. The maps show the type of biomass e.g forests, waste, agricultural specific crops yield housing needs biomass prices and energy demands, feedstock production and logistics, biofuel production and distribution, water needs and more.
38. Interactive Wind Farm maps
Source: energy.gov
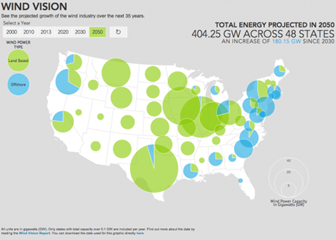
Interactive wind farm maps provide detailed information on wind farms. They show precise functions for thousands of individual turbines, generating capacity, type of tower, blade length total height. The maps can be filtered to show turbines by height blade length generating capacity, etc.
39. Mining maps
Source: http://savethewildup.org/about/maps/
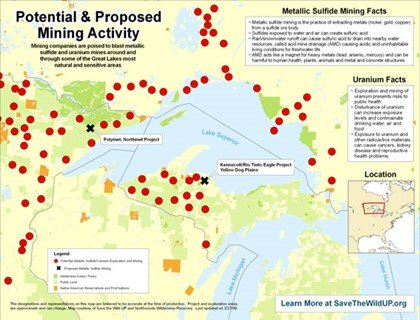
Mining maps are a combination of satellite imagery, aerial photography, and GIS that show mineral exploration projects, they are used to provide geologists, scientists, exploration managers, and field crew location of tracks, roads, fences, inhabited areas, etc. they help prospectors to access corridors for exploration areas, consider the environmental impact of large scale projects. They are us
40. Natural Resources maps
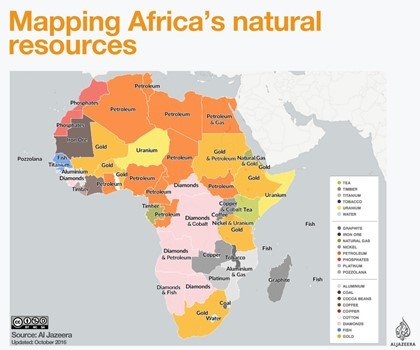
Natural Resources maps are GIS maps that show natural resources including agriculture, forestry, coastal management, etc they help monitor the natural resources used to help manage a wide ecological system, vegetation, geological and soil analysis, land surface climatology, hydrology, land cover change, etc.
41. Energy Industry maps
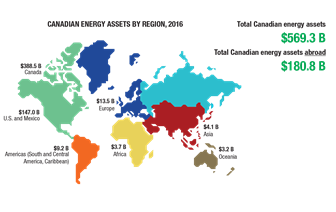
Remote sensing is important in explorative activities. Energy industry maps to aid in the selection and development of oil and gas exploration in areas around the world. Through geological and geophysical seismic interpretation and the use of orthorectified satellite images, they provide insight into selected areas. For seismic surveys and exploration drilling programs.
42. Pipeline maps
Source: https://www.americangeosciences.org/critical-issues/maps/interactive-map-pipelines-united-states
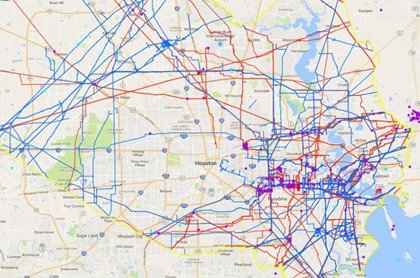
Pipeline maps are GIS maps that show pipelines. Pipelines cover thousands of miles and are located in remote hard to reach areas, utility governments, and government agencies use high-resolution satellite imagery to identify monitor and manage transmission corridors, locate leakages and disaster management, etc
43. Electricity Grid Maps
Electricity grid network Map Show transmission power lines in a geographical region. They help to monitor transmission corridors, vegetation intrusion and cable placement of power lines.
44. Solar Energy Suitability
Solar energy suitability maps show locations and include month by month potential of solar energy production, they also existing solar installations boundaries and other utility services like electricity service providers.
45. Energy Resources Map
Energy resources maps are GIS interactive maps that provide a wide range of information on energy resources in a region, the resources include gas and oil exploration activities dating back to 2005, geothermal potential, wind turbines and data on coal.
46. Coastal and Marine Geoscience Map
Source: https://cmgds.marine.usgs.gov/
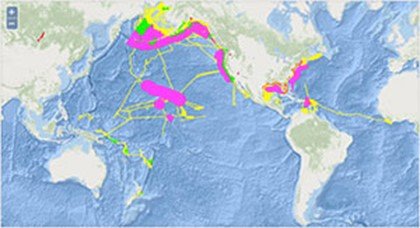
Coastal and marine geoscience maps are different map layers that show a wide range of geoscience-related information like active offshore and gas leases, drilling platforms, oil and gas well pipeline, active offshore renewable energy, offshore energy potential for sea currents, tides waves and wind, detailed seafloor bathymetry, coastal energy facilities seafloor geology, seafloor sediments type texture and thickness oceans disposal sites and much more.
47. Oil and gas wells Maps

Oil and gas wells maps show permitted oil and gas wells in different regions, they show information like injection producer, saltwater disposal, plugged and abandoned wells, junked wells never drilled wells and temporarily abandoned wells.
48. Oil Sands Maps
Oil sands maps are interactive maps that show information on oil sand regions, the maps include information on ownership, mineral restrictions, oil sands agreements, they will have layers that include roads and railway, topography, Lakes Rivers, parks and protected areas.
49. Offshore sand and gravel Maps
Offshore sand gravel maps are interactive maps that provide information on offshore sand and gravel resources, they include information on marine mineral lease and dredge areas, sediment core, water samples, surficial sedimentary geology including sediment composition and thickness, submarine cables, pipelines platforms, and other obstructions.
50. Industrial mineral mines Maps
Industrial mineral maps show information about industrial mineral mines like stones, aggregates, clay, they include commodity being mined, type, size of mines in acreage, operator details. They will also show metallic minerals waste management in the mine areas etc.
51. Coal Mines Maps
Coal mines maps show information on coal mines and mined areas. They include information such as mine status mine owner type, seam thickness, they can include overlay information on oil and gas activity in the region.
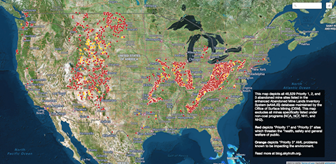
52. Abandoned mines Maps
Source: https://skytruth.org/2015/10/mapping-abandoned-coal-mines/
These are maps that show abandoned mines by region, they show individual sites, the commodity that was mined there, date and method of closure, cost of closure, depth and size of mine shafts, whether coal was present, etc.
53. Aggregate resources mines Maps
Aggregate resources mines maps show sand and construction aggregate mining operations, they include information on location, operators, material mined, mining dates total are and reclaimed area.
54. Fault activity Maps
Fault activities interactive maps allow users to identify locations and classifications of geological fault lines and recent activities on each fault segment surface rupture areas and whether or not faults are visible on the surface.
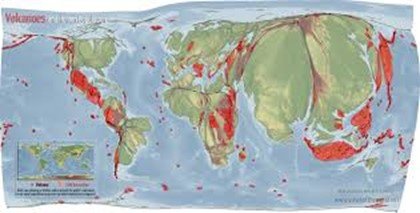
55. Volcanoes and Volcanic Activities Maps
Source: http://www.viewsoftheworld.net/?p=4461
Volcanic and volcanic activity maps are GIS geological survey maps that show current alerts of volcanoes by location and activity level. They show volcano status by color levels, green being normal, yellow advisory, orange watch, and red warning.
56. Earthquake hazard Zones Maps
Earthquake hazard zone maps are interactive maps threat detail the risk of earthquake-related hazards in different areas, they show fault lines, landslide zones, liquefaction zones, they also include areas that have not yet been evaluated.
57. Carbon Dioxide Storage Maps

Source: https://www.reddit.com/r/MapPorn/comments/5zye79/world_map_of_deforestation_status_since_1990_and/
Carbon dioxide storage maps detail information on storage assessment for sedimentary basins and includes potential storage, individual formations, and detailed stratigraphic charts
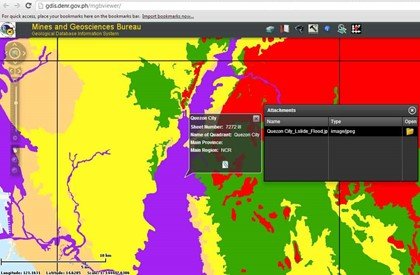
58. Geohazards Maps
Source: https://www.foreclosurephilippines.com/check-geohazard-maps-before-investing-in-real-estate/
Geohazards maps show geohazards like earthquakes, active faults, historical epicenters, expected shaking and liquefaction hazards, tsunami, inundation, volcanoes, landslides, floods, and coastal erosions.
59. Tsunami evacuation information Maps
Tsunami evacuation maps give information about tsunami evacuation procedures by locality which includes evacuation zones, evacuation routes, evacuation assembly areas local landmarks.
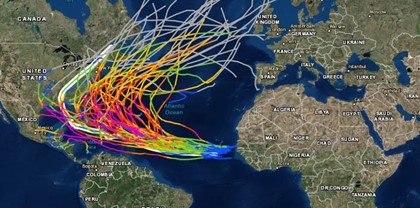
60. Hurricane Path Maps
Source: https://oceanservice.noaa.gov/news/historical-hurricanes/
Hurricanes path maps track hurricane and tropical cyclones around the world and have information that date as far back as 1842. They show category, wind speed and a minimum pressure of each hurricane at different points and much more.
61. Landslides Maps
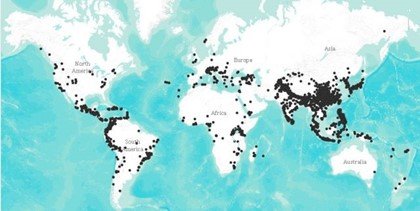
Source: https://blogs.agu.org/landslideblog/2018/08/28/mapping-global-landslides/
Landslide maps display landslide locations and reports and vary both historically and recent landslides.
62. Parks maps

Source: https://www.parksbloggerontario.com/interactive-outdoor-maps-of-ontario/
Physical maps show the location of recreational parks including game parks, they show vegetation, fun activities, and much more.
63. Elevations maps
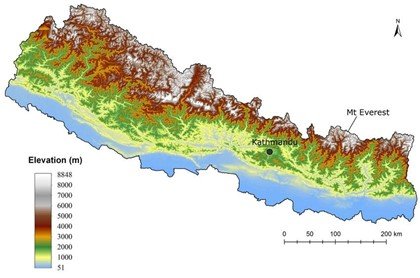
Source: https://www.researchgate.net/figure/Elevation-map-of-Nepal_fig1_319183873
Elevation maps depict geographical elevations in different geographical zones in relation to the sea level.
64. Towns and Municipalities
Town and municipalities maps show various towns and their municipalities and all related features including population density, road network emergency facilities, etc.
65. Cities
Cities maps show different cities of the world their positions physical features infrastructure transportation network streets buildings and locations.
66. Political boundaries
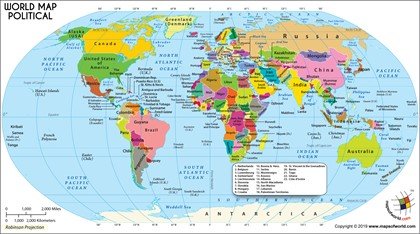
Source: https://www.mapsofworld.com/large-world-map-in-robinson-projection.html
Political boundaries maps are physical maps that show the boundaries of different administrative zones in relation to population and availability of services.
67. Latitude and longitude
Latitude and longitude maps just like the name depict show the earth’s latitudes and longitude lines in relation to each other.
68. Provincial parks
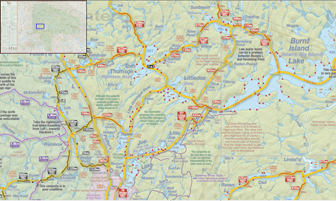
Provincial Park maps local recreational parks.
69. Geographical planning
Geographical planning maps show future plans of a region in relation to its geopolitical location, geographical features availability of natural resources like water, etc.
70. Civil engineering
Civil engineering maps show civil works in urban centers, bridges, waterways, roads, tramways, and any other man-made features.
71. Large-scale architecture
Large scale architectural works encompass large tracts of land. Architectural maps help locate every component of the works.
72. Urban development
Physical maps are also used as planning tools for urban development infrastructure construction.
73. Geologic Maps
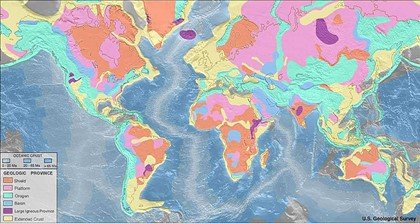
Source: https://en.wikipedia.org/wiki/Geologic_map
The geological maps show, different colors for different types of rocks to help prospectors and developers understand the [physical location.
74. Mountains Maps
Mountain maps give locations of all the major mountains in the world, they show elevation, geographical features, wildlife, vegetation, topography, snow and ice conditions and much more.
75. Soil type Maps

Source: https://www.nrcs.usda.gov/wps/portal/nrcs/detail/soils/use/maps/?cid=nrcs142p2_053997
Soil type Maps show different soil structures in a region, they can be used by developer’s farmers and urban planners to help them calculate the cost of investment according to the soil profile.
Physical maps help us know ourselves in relation to our physical environment they are a rich source of information to everybody.



s
8 Aug 2021these are topographic maps and not physical maps