
Microsoft Excel 2013 has the capability to draw nice map. The number that are on your sheet can be plotted on the map without living the Excel. No need of any fancy GIS software to draw it. You can create 3D map too. Bing maps is used as a base map. Map can be a globe or flat format. Power Map has all the options available to create great looking maps. It is a plugin used to draw maps on it. User need to download this plugin from the Microsoft official website. Below is the step by step process to create a map along with other features.
Step by step to draw the maps on the Power Map
First step is to download the plugin.
Downloading the Plugins
1. Go to the Microsoft official website to download the plugins.Download
2. Then run the setup wizard by clicking the downloaded file Microsoft Power Map Preview for Excel.exe

3. Then press Next and checked the I Agree button, again press Next.
4. After all the above process the Power Map will run for a while to install all the required files. After finishing the installation click close.

5. Then open the Microsoft Excel, if it does not show Power Map icon on the Insert tab. Then follow the a , b and c process to activate, if not just go to step 6.

Step to Add Power Map Tab if it does not show.
- Go to File > Options > Add-Ins
- In the Manage box, click the drop-down arrow > COM Add-ins > Go
- Check the Microsoft Power Map > OK


6. I have copied 50 largest populated cities in Canada from the Wikipedia. You can download the clean data or you can get from Wikipedia. Our target is to plot different type of maps from this data.

7. Then click on the Lunch Power Map from the Map icon.

8. It will take a few minutes to load the Map window and below is the map screen window.

Make sure Census Subdivision is checked. Because we want to plot all the cities values. After all this click Next.
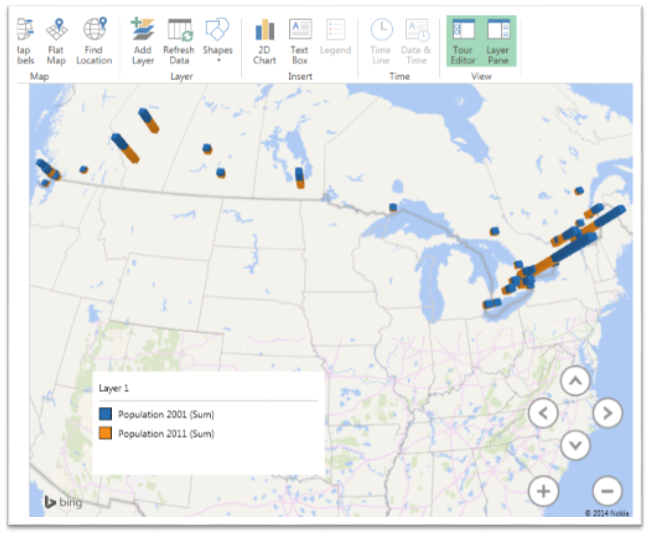
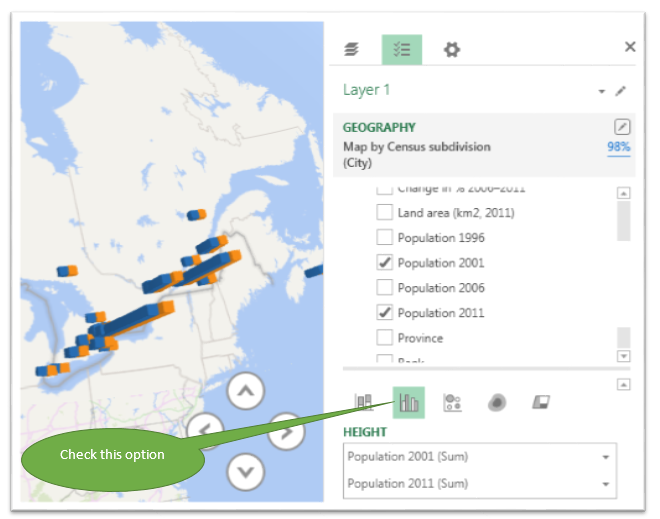
9. On the next window we will select the fields that we want to draw. See the image below. Check the Population 2001 and Population 2011, we will draw the bar chart diagram, by default it will draw bar chart.

On the map by default it will show the legend you can close it by clicking x button. If you need that back again then click the legend button. You can zoom in zoom out, adjust north or the map according to your need.
10. You can change the charts to clustered type by checking the clustered column. Map look will change. In same way we can change map type to heat map, bubble and to region (thematic map).
11. On the below map the option is bubble with province total 2011 population.

12. Now to change the color click on the setting tab and change the blue color to green. Change the formatting option to get the better look. See below image.


Some other options on the map.
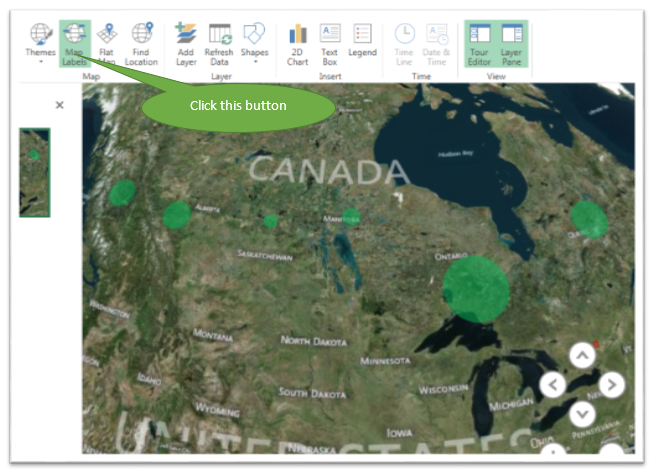
You can change the Themes of the map.

You can add labels on the map by clicking map labels button.
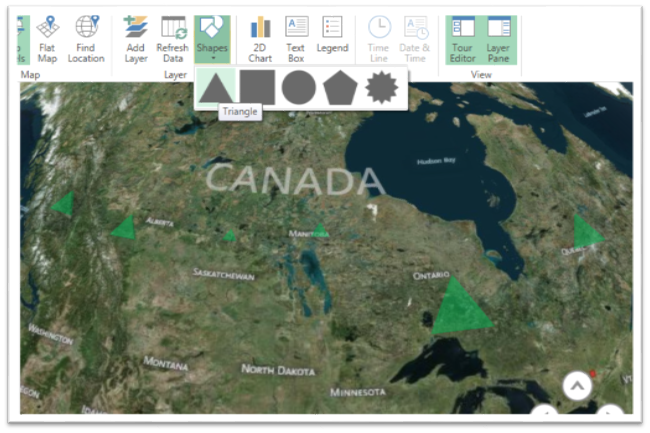
You can change the shape of icons by selecting type of symbol from the shapes button.
You can create a flat map by clicking the flat map button.


Ram
13 Jan 2015Great Tutorial, Thank you for sharing
Leo Sauermann
18 Aug 2015Thanks for the step-by-step instructions. It helps to have the basics.
We built a concrete use of Power Map for analyzing the call reports of sales reps/field reps who were working on sales routes, see here:
http://www.portatour.com/blog/en/blog/2015/08/17/analyze-field-reps-call-reports-on-a-map-with-excel-and-power-map/
Power Map deserves being named “Power”.
admin
18 Aug 2015Thanks Leo, Your article looks great.
dot corsi
29 Mar 2016Valuable post . I was fascinated by the facts – Does anyone know where my business could grab a template CA ADOPT-200 copy to fill out ?
Wayne Greenhalgh
9 Dec 2016Hi,
I launch Power Map but then my excel stops working and Power map disappears for the “Insert” section.
help please.
Thanks
Wayne
admin
9 Dec 2016I will see and update you, thank you
Luis Bravo
13 Jan 2017Dear friend
My power map, doesn’t show the option for a new custom map. Just new scene option and there is not other options inside.
What can I do to make a custom map with a different image file?
Excel 2013 – Win10
Thank you for your support
admin
13 Jan 2017Thanks Luis, I will update you