
[vc_row margintop=”0″ marginbottom=”15″ paddingtop=”0″ paddingbottom=”0″ bg_color=”#ffffff” bg_repeat=”repeat” bg_stretch=”no” en_border=”no” border_color=”#e8e8e8″][vc_column][vc_column_text]
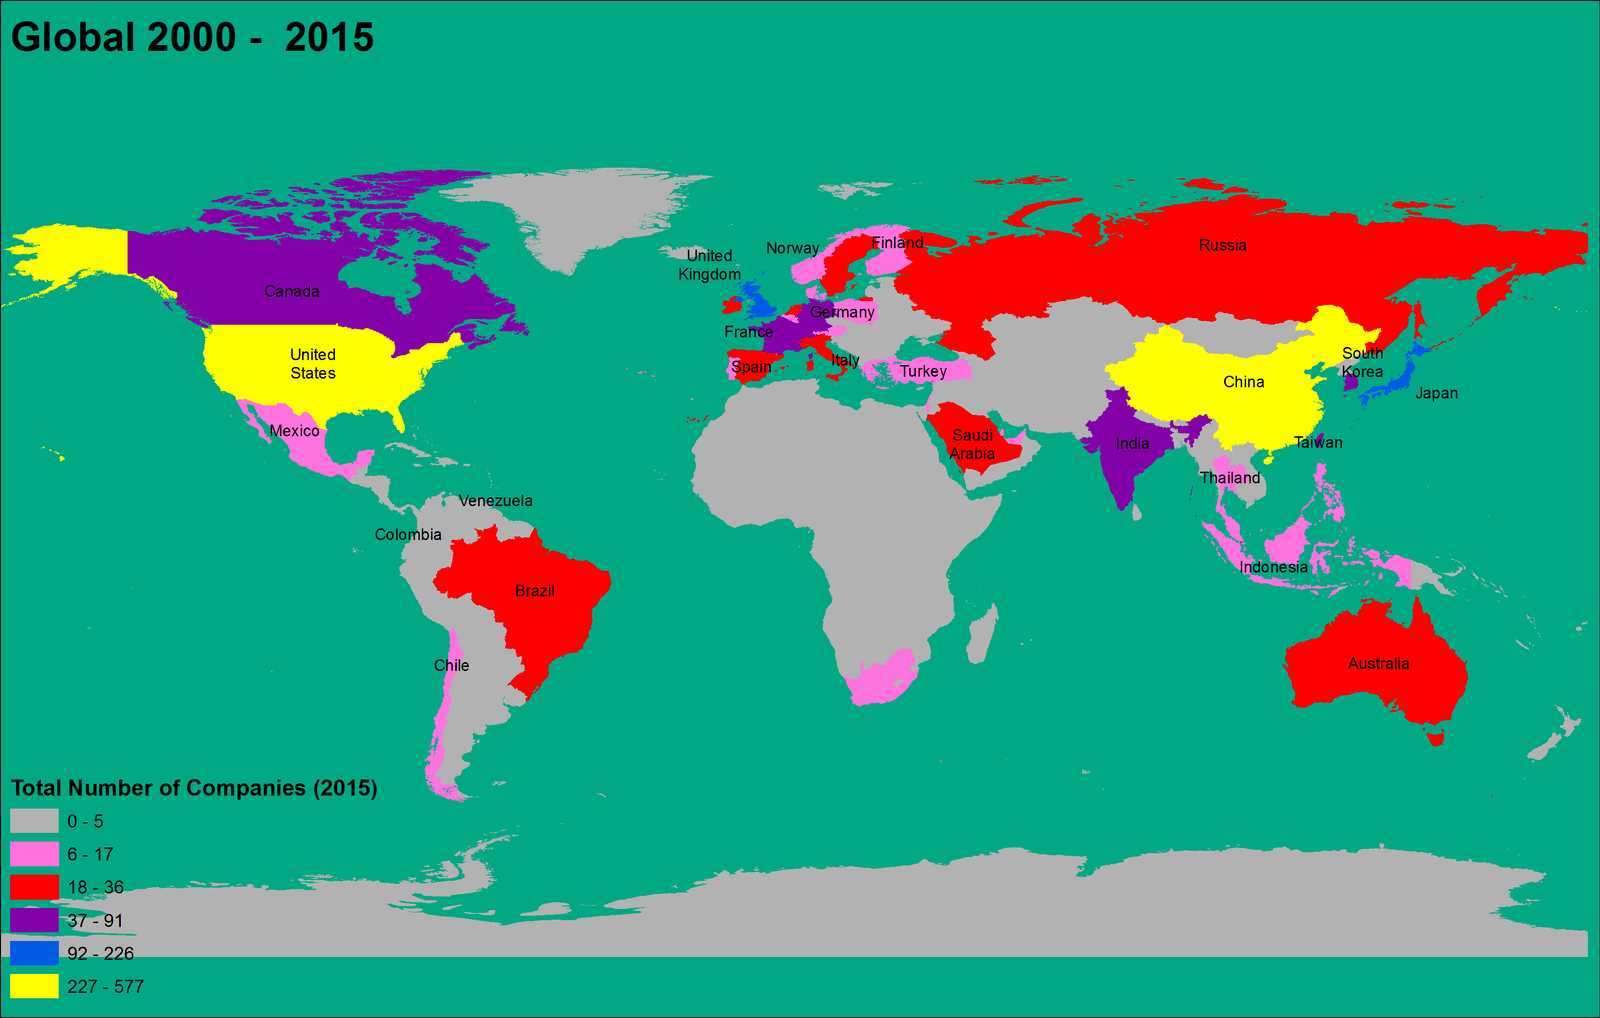
It was great to see new Global 2000 list for the Year 2015. Lot of changes happened, again China and the USA are ruling the economic market. China Banking market is taking top four spot compare to three last year 2014. Berkshire Hathaway is maintaining its 5th position. Total number of companies in the USA has increased from the 563 to 577. Global 2000 Company ranking are published by Forbes Magazine every year and it uses sales, profit, assets and market value to assess the position of companies.
For 2015 China total number of companies has increased from 207 to 232 with 12 percentage of increase and Japan went from 226 to 219 with 3 percentage decrease. Japan has lost its 2nd position to China. 4 companies were added up for the United Kingdom, went up from 91 to 95. France saw changes, was 66 last year and came down to 61. It lost it,s 5th position to South Korea.
[/vc_column_text][vc_separator style=”blank” padding_top=”15″ padding_bottom=”15″][/vc_column][/vc_row][vc_row margintop=”0″ marginbottom=”15″ paddingtop=”0″ paddingbottom=”0″ bg_color=”#ffffff” bg_repeat=”repeat” bg_stretch=”no” en_border=”no” border_color=”#e8e8e8″][vc_column][vc_column_text]The table showing the percentage change:
|
Country |
Company (2014) |
Company |
Percentage |
|
United States |
563 |
577 |
2% |
|
Japan |
226 |
219 |
-3% |
|
China |
207 |
232 |
12% |
|
United Kingdom |
91 |
95 |
4% |
|
France |
66 |
61 |
-8% |
|
South Korea |
61 |
66 |
8% |
[/vc_column_text][vc_separator style=”blank” padding_top=”15″ padding_bottom=”15″][vc_column_text]
This year 61 countries were on the Global 2000 list. Cayman Islands, Mauritius and Togo could not fine their spot this year but Argentina and Cyprus were the new name. This year total sales is 38.97 trillion, profit is 2.9 trillion, market value is 48.07 trillion and assets value is 162.24 trillion.
[/vc_column_text][vc_separator style=”blank” padding_top=”30″][ctitle title=”Top Five Company.” color=”#000000″ background=”#ffffff” font_size=”20″][/vc_column][/vc_row][vc_row margintop=”0″ marginbottom=”15″ paddingtop=”0″ paddingbottom=”0″ bg_color=”#ffffff” bg_repeat=”repeat” bg_stretch=”no” en_border=”no” border_color=”#e8e8e8″][vc_column][vc_column_text]
The USA had 49 percentage out of 1189 companies (top 5 total) and 29 percentage out of 2001 companies this year. China has taken 2nd position with 20 percentage out of 1189 companies (top 5 total) and 12 percentage out of 2001 companies.
|
Country |
Company |
Sales (Billion) |
Profits (Billion) |
Assets (Billion) |
Market Value (Billion) |
|
United States |
577 |
11981.03 |
1027.731 |
19929.788 |
38618.23 |
|
China |
232 |
4569.939 |
472.9 |
6039.056 |
25217.443 |
|
Japan |
219 |
4333.907 |
204.259 |
3175.471 |
14882 |
|
United Kingdom |
95 |
2223.254 |
180.269 |
2490.6 |
14248.5 |
|
South Korea |
66 |
1466.4 |
62.134 |
764.937 |
3425 |
|
Total |
1189 |
24574.53 |
1947.293 |
32399.852 |
96391.173 |
[/vc_column_text][vc_separator style=”blank” padding_top=”15″ padding_bottom=”15″][vc_column_text]
|
Country |
Company |
Out of 1189 |
Out of 2001 |
|
United States |
577 |
49% |
29% |
|
China |
232 |
20% |
12% |
|
Japan |
219 |
18% |
11% |
|
United Kingdom |
95 |
8% |
5% |
|
South Korea |
66 |
6% |
3% |
|
Total |
1189 |
100% |
59% |
|
Total Global 2000 Companies 2015 |
2001 |
|
|
[/vc_column_text][/vc_column][/vc_row][vc_row margintop=”25″ marginbottom=”25″ paddingtop=”0″ paddingbottom=”0″ bg_color=”#ffffff” bg_repeat=”repeat” bg_stretch=”no” en_border=”no” border_color=”#e8e8e8″][vc_column][vc_single_image image=”1076″ img_size=”large” img_link_large=”yes”][vc_message color=”general”]
Top five country total company make 59 percentage of the Global 2000. The remaining 56 countries make 41 percentage. The Global 2000 for the year 2015 total countries were 61.
[/vc_message][/vc_column][/vc_row][vc_row margintop=”25″ marginbottom=”15″ paddingtop=”0″ paddingbottom=”0″ bg_color=”#ffffff” bg_repeat=”repeat” bg_stretch=”no” en_border=”no” border_color=”#e8e8e8″][vc_column][vc_single_image image=”1081″ img_size=”large” img_link_large=”yes”][vc_separator style=”double” padding_top=”30″][/vc_column][/vc_row][vc_row margintop=”15″ marginbottom=”15″ paddingtop=”0″ paddingbottom=”0″ bg_color=”#ffffff” bg_repeat=”repeat” bg_stretch=”no” en_border=”no” border_color=”#e8e8e8″][vc_column][ctitle title=”Company by the Continent.” color=”#000000″ background=”#ffffff” font_size=”20″][/vc_column][/vc_row][vc_row margintop=”0″ marginbottom=”0″ paddingtop=”15″ paddingbottom=”0″ bg_color=”#ffffff” bg_repeat=”repeat” bg_stretch=”no” en_border=”no” border_color=”#e8e8e8″][vc_column][vc_column_text]
Asia top the position with 794 companies and then the North America with 638 companies. Asia took 40 percentage , North America took 32 percentage and Europe have 22 percentage. See below table about the Total Sales, Profit, Assets and Market Value.
[/vc_column_text][/vc_column][/vc_row][vc_row][vc_column][vc_column_text]
|
Continent |
Company |
Sales (Billion) |
Profits (Billion) |
Assets (Billion) |
Market Value (Billion) |
|
Asia |
794 |
13346.061 |
55243.44 |
1016.883 |
13549.427 |
|
North America |
638 |
12835.446 |
44368.26 |
1109.178 |
21129.388 |
|
Europe |
451 |
11063.383 |
54868.71 |
644.619 |
11293.892 |
|
South America |
63 |
1063.718 |
3331.248 |
54.821 |
890.251 |
|
Oceania |
34 |
529.227 |
3796.8 |
65.566 |
896.2 |
|
Africa |
21 |
133.802 |
637.3 |
19.829 |
315 |
|
Total |
2001 |
38971.637 |
162245.8 |
2910.896 |
48074.158 |
[/vc_column_text][/vc_column][/vc_row][vc_row margintop=”25″ marginbottom=”15″ paddingtop=”0″ paddingbottom=”0″ bg_color=”#ffffff” bg_repeat=”repeat” bg_stretch=”no” en_border=”no” border_color=”#e8e8e8″][vc_column][vc_single_image image=”1090″ img_size=”large” img_link_large=”yes”][vc_separator style=”double” padding_top=”30″][/vc_column][/vc_row][vc_row margintop=”15″ marginbottom=”15″ paddingtop=”0″ paddingbottom=”0″ bg_color=”#ffffff” bg_repeat=”repeat” bg_stretch=”no” en_border=”no” border_color=”#e8e8e8″][vc_column][ctitle title=”Map Section:” color=”#000000″ background=”#ffffff” font_size=”20″][/vc_column][/vc_row][vc_row margintop=”0″ marginbottom=”15″ paddingtop=”0″ paddingbottom=”0″ bg_color=”#ffffff” bg_repeat=”repeat” bg_stretch=”no” en_border=”no” border_color=”#e8e8e8″][vc_column][vc_column_text]
Thematic Map of the Forbes Global 2000 Company for the Year 2015
 [/vc_column_text][/vc_column][/vc_row][vc_row margintop=”35″ marginbottom=”15″ paddingtop=”0″ paddingbottom=”0″ bg_color=”#ffffff” bg_repeat=”repeat” bg_stretch=”no” en_border=”no” border_color=”#e8e8e8″][vc_column][vc_column_text]
Point and Chart Map of the Forbes Global 2000 Company for the Year 2015
 [/vc_column_text][/vc_column][/vc_row][vc_row margintop=”35″ marginbottom=”15″ paddingtop=”0″ paddingbottom=”0″ bg_color=”#ffffff” bg_repeat=”repeat” bg_stretch=”no” en_border=”no” border_color=”#e8e8e8″][vc_column][vc_column_text]
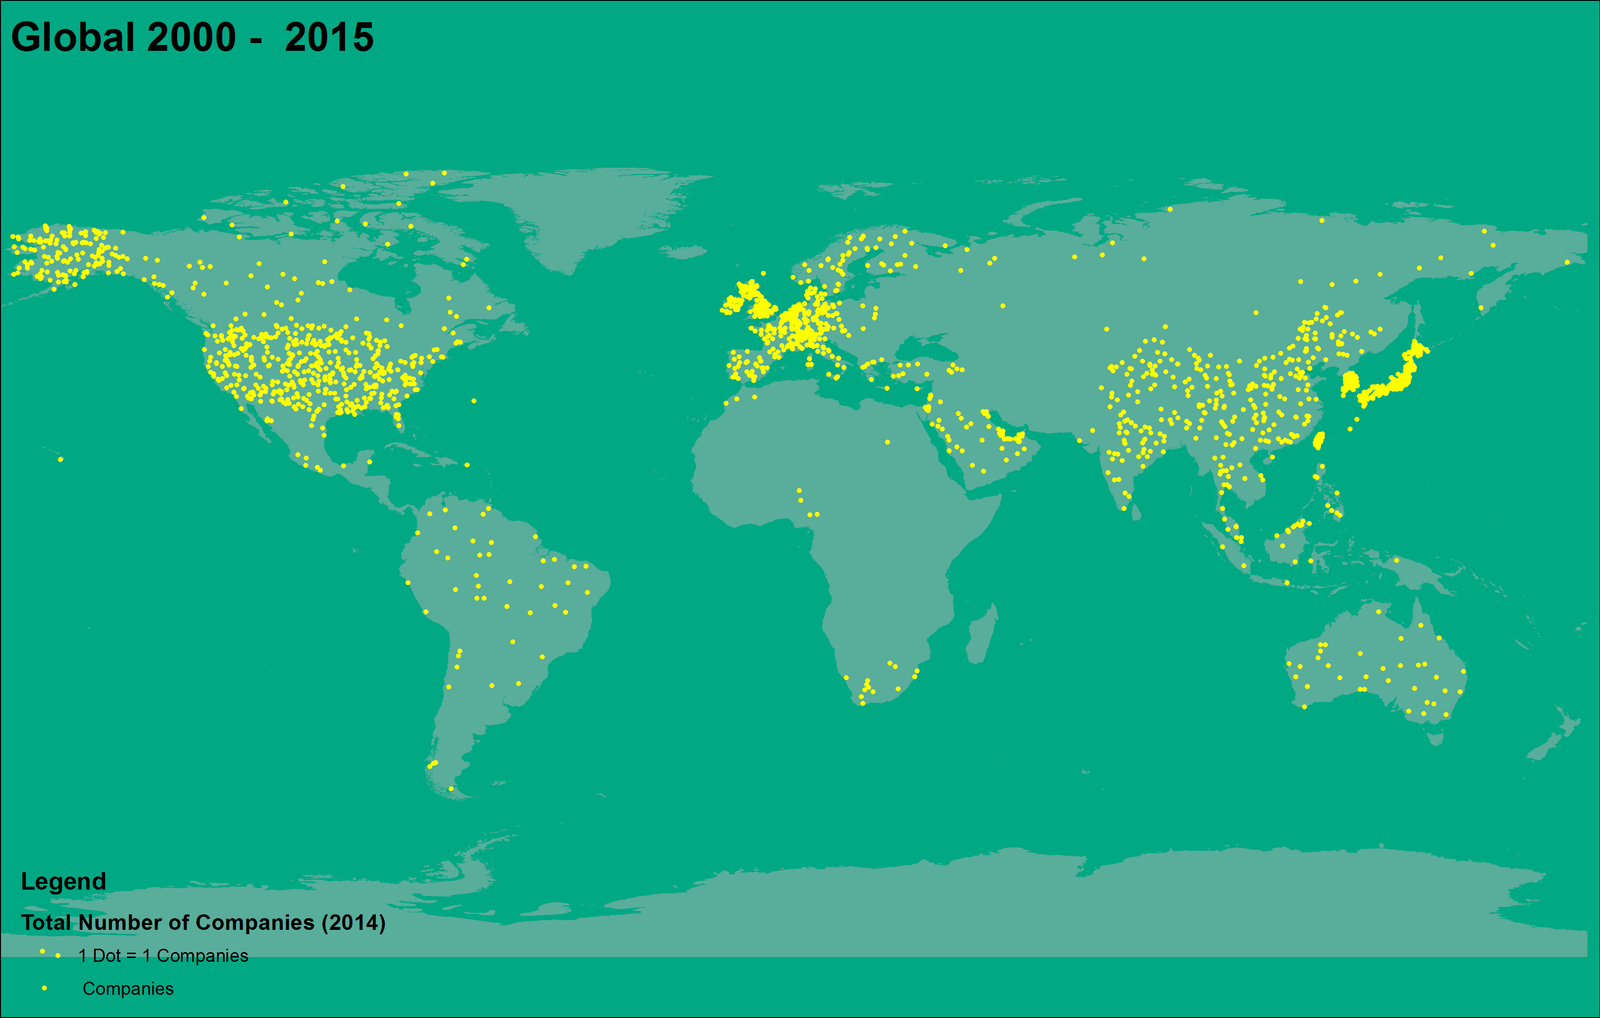
Dot Density Map of the Forbes Global 2000 Company for the Year 2015
 [/vc_column_text][/vc_column][/vc_row][vc_row margintop=”50″ marginbottom=”50″ paddingtop=”0″ paddingbottom=”0″ bg_color=”#ffffff” bg_repeat=”repeat” bg_stretch=”no” en_border=”no” border_color=”#e8e8e8″][vc_column][tagline_box call_text=”NOW READ:” call_text_small=”Mapping of 2014 Forbes Global 2000 Public Companies” title=”Read” color=”grey” margin=”0″ href=”http://grindgis.com/statistics/mapping-of-2014-forbes-global”][/vc_column][/vc_row][vc_row][vc_column][vc_column_text]
More Resources:
List of Global 2000 for 2015
The World’s Largest Companies 2015
The World’s Largest Tech Companies: Apple Beats Samsung, Microsoft, Google[/vc_column_text][/vc_column][/vc_row]


Simon Kuestenmacher
21 Jun 2015Hi, I love the mapping you’ve done here. I’d like to replicate the point and chart map you’ve done. I couldn’t find the link to the excel file of the 2015 Forbes Global 2000 list. Where can I find the file? Your help is much appreciated! Cheers, Simon K
admin
22 Jun 2015Hi Simon,
Appreciate for your Comment, are you looking for the GIS shapefiles and Arcmap mxd file?
Thanks,
Pramod
Simon Kuestenmacher
20 Aug 2015Hi, the simple excel file with the Global 2000 data for 2015 would be enough as I got access to all relevant shape files in our systems. Thank you!
Oge
2 Sep 2015I love this its very helpful.
thanks you admin
admin
2 Sep 2015Thank you
Gustavo Leig
19 Nov 2015Hi, excellent work.
I´m doing a research for my MBA here in Brazil and I will love to have the excel file.
Do you have the 2005 rank list also?
Thanks
admin
19 Nov 2015Thank you for the comment, I will see if I have.
Gustavo Leig
23 Nov 2015Also, I would appreciate this post excel file as well.
thanks
admin
23 Nov 2015Thanks, I will see what I can do.
Michael Britton
6 Jan 2016Any chance we could see the Excel (*.xls) file for this data; NOT the GIS shapefiles and Arcmap mxd files. Just the EXCEL file.
Vishal
8 Feb 2016Hi
This is great. It would be really helpful if you could share the list in an excel file
Maureen Fohey
11 Mar 2016Do you have the excel file for 2015 that you are willing to share?
admin
16 Mar 2016Please go to their website to get the data.
Gorakshnath Vahile
8 May 2016Really great data presented, but I can’t understand that why India is always back for all this type of work.
admin
9 May 2016Well Said.. Thank you
Carolien de Bruin
11 May 2016Hi – I have tried to find the excel file for this list, yet it doesn’t seem to be freely available. Any chance you can help (and/or anyone else that can help to share this)? Appreciate your support!
Carolien de Bruin
admin
26 May 2016Ok Carolien, send me blank email.
Harry Henry
19 May 2016You might also want to take a look at the data on the Global 5000 — goes beyond just 500 companies to 5,000. Includes those firms that are publicly reporting (like Fortune does) and has the largest private firms as well.
The data has been mapped via Tableau – http://tabsoft.co/1Xn68Au
admin
26 May 2016Thank you Harry, I will work on it.
PIerre
14 Jun 2017Hi, great job here!
I am also looking for a Excel historical data on Global 2000 ranking.
2014 and/or 2015 would be a good start.
Does anyone have this?
Thanks in advance.
Best,
Pierre
Stefany
1 Apr 2019Would you please mind to share the Excel sheet with the historical Forbes data? I know it is available online, but would just require some time to scrape. Thank you kindly.