[vc_row margintop=”0″ marginbottom=”15″ paddingtop=”0″ paddingbottom=”0″ bg_color=”#ffffff” bg_repeat=”repeat” bg_stretch=”no” en_border=”no” border_color=”#e8e8e8″][vc_column][vc_column_text]
It was again great to see new Global 2000 list for the Year 2016. Lot of changes happened esp big 6 countries, again China and the USA are ruling the economic market. China Banking market is taking top three spot compare to four last year 2015. Berkshire Hathaway has changed its position from 5th to 4th, great job Warren Buffet. Total number of companies in the USA has increased from the 577 to 586. Global 2000 Company ranking are published by Forbes Magazine every year and it uses sales, profit, assets and market value to assess the position of companies.
For 2016 China total number of companies has increased from 232 to 249 with 7.33 percentage of increase and Japan no change from 219 to 219 and still maintain its 3rd position. United Kingdom saw less changes, total companies went from 95 to 92, probably in year 2017 we might see major changes due to Brexit. South Korea still maintain its 5th position .
[/vc_column_text][vc_separator style=”blank” padding_top=”15″ padding_bottom=”15″][/vc_column][/vc_row][vc_row margintop=”0″ marginbottom=”15″ paddingtop=”0″ paddingbottom=”0″ bg_color=”#ffffff” bg_repeat=”repeat” bg_stretch=”no” en_border=”no” border_color=”#e8e8e8″][vc_column][vc_column_text]The table showing the percentage change:
|
Country |
Company (2015) |
Company |
Percentage |
|
United States |
577 |
586 |
2% |
|
Japan |
219 |
219 |
0% |
|
China |
232 |
249 |
7% |
|
United Kingdom |
95 |
92 |
-3% |
|
France |
61 |
61 |
0% |
|
South Korea |
66 |
67 |
2% |
[/vc_column_text][vc_separator style=”blank” padding_top=”15″ padding_bottom=”15″][vc_column_text]
This year 61 countries were on the Global 2000 list, same as last year. Cyprus and Puerto Rico could not fine their spot this year but Malta and Romania were the new name. This year total sales is 35.16 trillion, profit is 2.41 trillion, market value is 44.45 trillion and assets value is 161.61 trillion.
[/vc_column_text][vc_separator style=”double” padding_top=”30″][ctitle title=”Top Five Company.” color=”#000000″ background=”#ffffff” font_size=”20″][/vc_column][/vc_row][vc_row margintop=”0″ marginbottom=”15″ paddingtop=”0″ paddingbottom=”0″ bg_color=”#ffffff” bg_repeat=”repeat” bg_stretch=”no” en_border=”no” border_color=”#e8e8e8″][vc_column][vc_column_text]
It was again great to see new Global 2000 list for the Year 2016. Lot of changes happened esp big 6 countries, again China and the USA are ruling the economic market. China Banking market is taking top three spot compare to four last year 2015. Berkshire Hathaway has changed its position from 5th to 4th, great job Warren Buffet. Total number of companies in the USA has increased from the 577 to 586. Global 2000 Company ranking are published by Forbes Magazine every year and it uses sales, profit, assets and market value to assess the position of companies.
For 2016 China total number of companies has increased from 232 to 249 with 7.33 percentage of increase and Japan no change from 219 to 219 and still maintain its 3rd position. United Kingdom saw less changes, total companies went from 95 to 92, probably in year 2017 we might see major changes due to Brexit. South Korea still maintain its 5th position .
[/vc_column_text][vc_column_text]The table showing the percentage change:
|
Country |
Company (2015) |
Company |
Percentage |
|
United States |
577 |
586 |
2% |
|
Japan |
219 |
219 |
0% |
|
China |
232 |
249 |
7% |
|
United Kingdom |
95 |
92 |
-3% |
|
France |
61 |
61 |
0% |
|
South Korea |
66 |
67 |
2% |
[/vc_column_text][vc_separator style=”blank” padding_top=”15″ padding_bottom=”15″][vc_column_text]
This year 61 countries were on the Global 2000 list, same as last year. Cyprus and Puerto Rico could not fine their spot this year but Malta and Romania were the new name. This year total sales is 35.16 trillion, profit is 2.41 trillion, market value is 44.45 trillion and assets value is 161.61 trillion.
[/vc_column_text][vc_separator style=”double” padding_top=”30″][ctitle title=”Top Five Company.” color=”#000000″ background=”#ffffff” font_size=”20″][/vc_column][/vc_row][vc_row margintop=”0″ marginbottom=”15″ paddingtop=”0″ paddingbottom=”0″ bg_color=”#ffffff” bg_repeat=”repeat” bg_stretch=”no” en_border=”no” border_color=”#e8e8e8″][vc_column][vc_column_text]
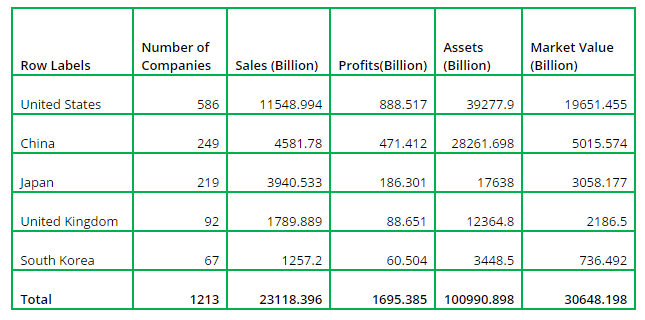
The USA had 48 percentage out of 1213 companies (top 5 total) and 29 percentage out of 2001 companies this year. China has taken 2nd position with 21 percentage out of 1213 companies (top 5 total) and 12 percentage out of 2001 companies.
[/vc_column_text][vc_separator style=”blank” padding_top=”15″ padding_bottom=”15″][vc_column_text] [/vc_column_text][vc_separator padding_top=”15″ padding_bottom=”15″][/vc_column][/vc_row][vc_row margintop=”25″ marginbottom=”25″ paddingtop=”0″ paddingbottom=”0″ bg_color=”#ffffff” bg_repeat=”repeat” bg_stretch=”no” en_border=”no” border_color=”#e8e8e8″][vc_column][vc_single_image image=”2341″ img_size=”large” onclick=”img_link_large”][vc_message]Top five country total company make 61 percentage of the Global 2000. The remaining 56 countries make 39 percentage. The Global 2000 for the year 2016 total countries were 61.[/vc_message][/vc_column][/vc_row][vc_row margintop=”25″ marginbottom=”15″ paddingtop=”0″ paddingbottom=”0″ bg_color=”#ffffff” bg_repeat=”repeat” bg_stretch=”no” en_border=”no” border_color=”#e8e8e8″][vc_column][vc_single_image image=”2342″ img_size=”large” onclick=”img_link_large”][vc_separator style=”double” padding_top=”30″][/vc_column][/vc_row][vc_row margintop=”15″ marginbottom=”15″ paddingtop=”0″ paddingbottom=”0″ bg_color=”#ffffff” bg_repeat=”repeat” bg_stretch=”no” en_border=”no” border_color=”#e8e8e8″][vc_column][ctitle title=”Company by the Continent.” color=”#000000″ background=”#ffffff” font_size=”20″][/vc_column][/vc_row][vc_row margintop=”0″ marginbottom=”0″ paddingtop=”15″ paddingbottom=”0″ bg_color=”#ffffff” bg_repeat=”repeat” bg_stretch=”no” en_border=”no” border_color=”#e8e8e8″][vc_column][vc_column_text]
Asia top the position with 807 companies and then the North America with 647 companies. Asia took 40 percentage , North America took 32 percentage and Europe have 22 percentage. See below table about the Total Sales, Profit, Assets and Market Value.
[/vc_column_text][/vc_column][/vc_row][vc_row][vc_column][vc_column_text]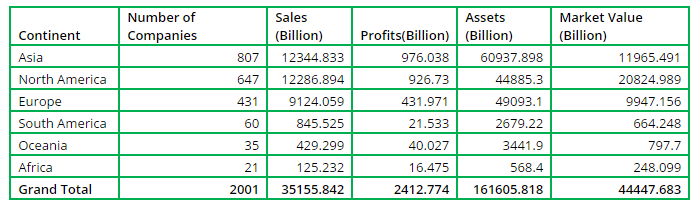 [/vc_column_text][vc_separator padding_top=”15″ padding_bottom=”15″][/vc_column][/vc_row][vc_row margintop=”25″ marginbottom=”15″ paddingtop=”0″ paddingbottom=”0″ bg_color=”#ffffff” bg_repeat=”repeat” bg_stretch=”no” en_border=”no” border_color=”#e8e8e8″][vc_column][vc_single_image image=”2345″ img_size=”large” onclick=”img_link_large”][vc_separator style=”double” padding_top=”30″][/vc_column][/vc_row][vc_row margintop=”15″ marginbottom=”15″ paddingtop=”0″ paddingbottom=”0″ bg_color=”#ffffff” bg_repeat=”repeat” bg_stretch=”no” en_border=”no” border_color=”#e8e8e8″][vc_column][ctitle title=”Map Section:” color=”#000000″ background=”#ffffff” font_size=”20″][/vc_column][/vc_row][vc_row margintop=”0″ marginbottom=”15″ paddingtop=”0″ paddingbottom=”0″ bg_color=”#ffffff” bg_repeat=”repeat” bg_stretch=”no” en_border=”no” border_color=”#e8e8e8″][vc_column][vc_column_text]
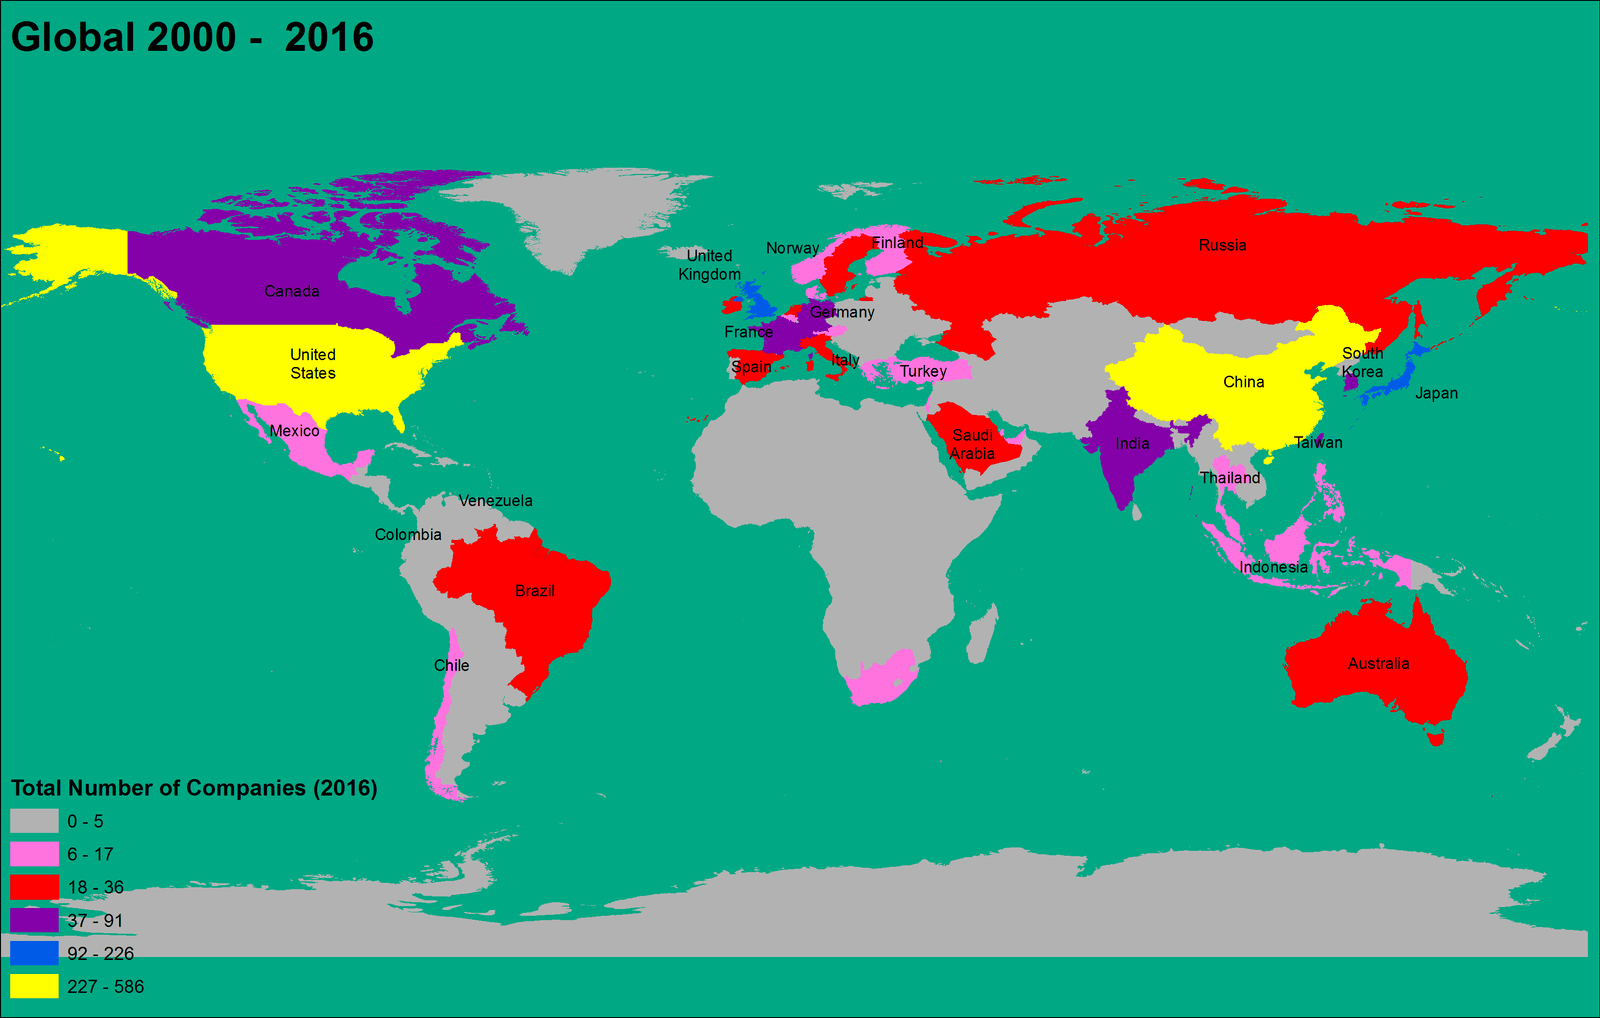
Thematic Map of the Forbes Global 2000 Company for the Year 2016
 [/vc_column_text][/vc_column][/vc_row][vc_row margintop=”35″ marginbottom=”15″ paddingtop=”0″ paddingbottom=”0″ bg_color=”#ffffff” bg_repeat=”repeat” bg_stretch=”no” en_border=”no” border_color=”#e8e8e8″][vc_column][vc_column_text]
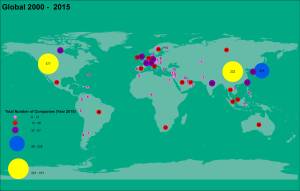
Point and Chart Map of the Forbes Global 2000 Company for the Year 2016
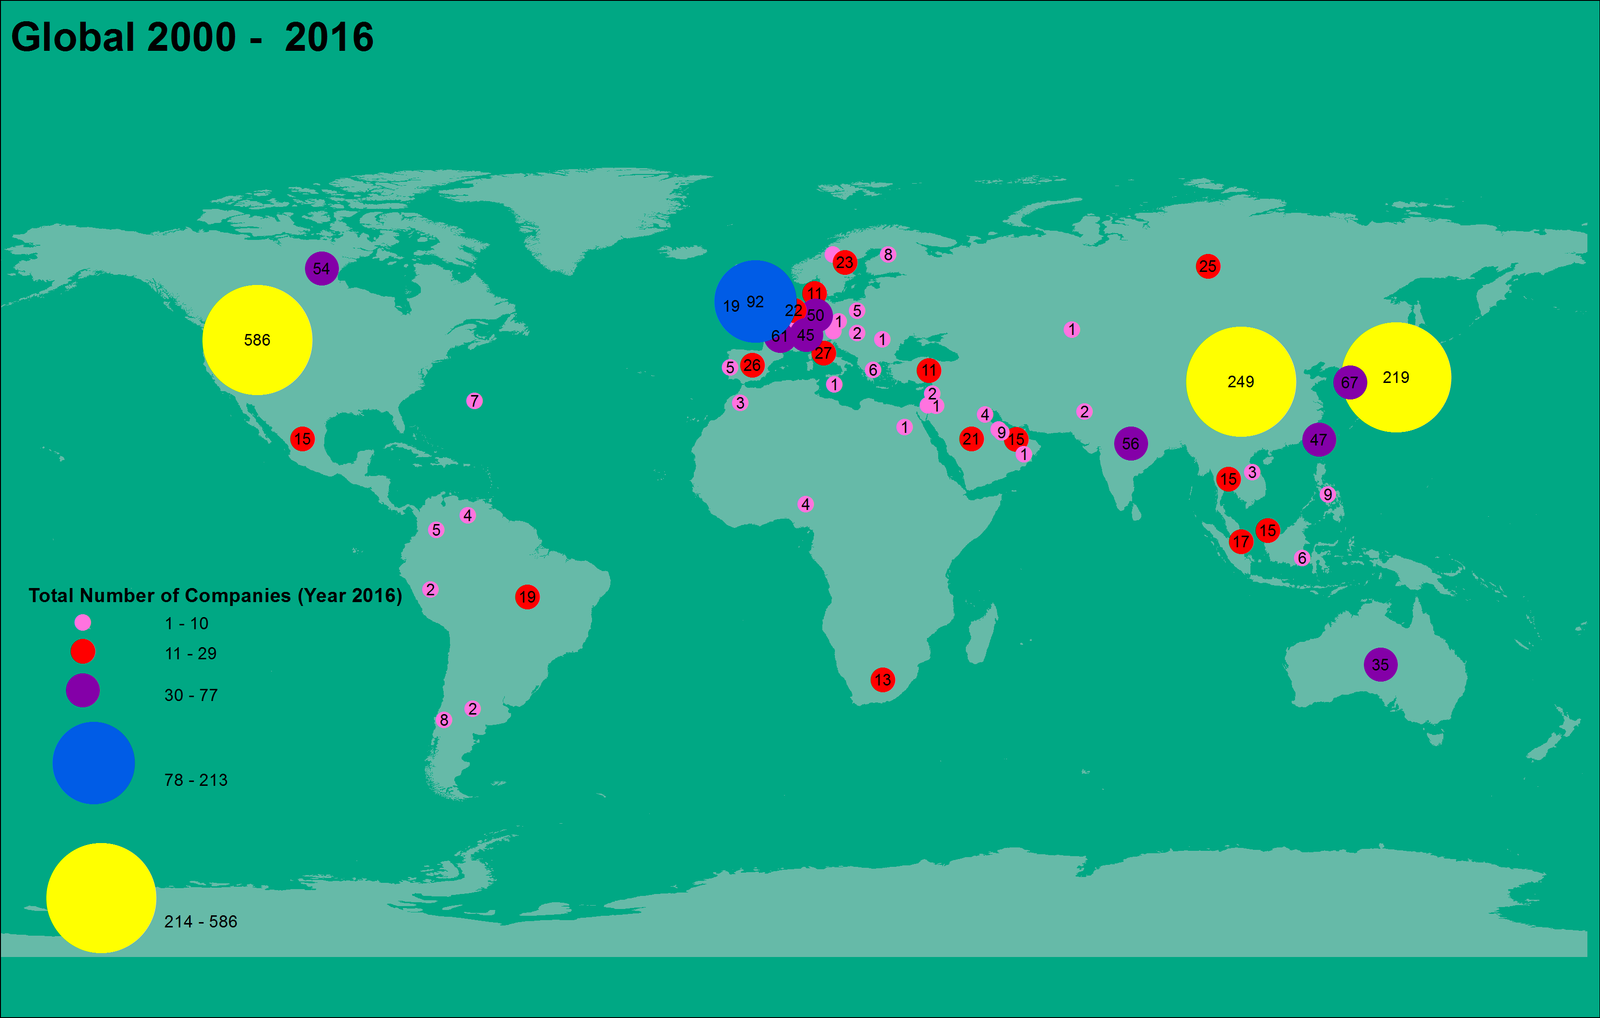 [/vc_column_text][/vc_column][/vc_row][vc_row margintop=”35″ marginbottom=”15″ paddingtop=”0″ paddingbottom=”0″ bg_color=”#ffffff” bg_repeat=”repeat” bg_stretch=”no” en_border=”no” border_color=”#e8e8e8″][vc_column][vc_column_text]
Dot Density Map of the Forbes Global 2000 Company for the Year 2016
 [/vc_column_text][vc_separator padding_top=”15″ padding_bottom=”15″][/vc_column][/vc_row][vc_row margintop=”50″ marginbottom=”50″ paddingtop=”0″ paddingbottom=”0″ bg_color=”#ffffff” bg_repeat=”repeat” bg_stretch=”no” en_border=”no” border_color=”#e8e8e8″][vc_column][tagline_box call_text=”NOW READ:” call_text_small=”Mapping of 2015 Forbes Global 2000 Public Companies” title=”Read” color=”grey” margin=”0″ href=”http://grindgis.com/statistics/mapping-of-2015-forbes”][/vc_column][/vc_row][vc_row][vc_column][vc_column_text]
More Resources:
List of Global 2000 for 2016
2016 Global 2000: The World’s Largest Transportation Companies[/vc_column_text][/vc_column][/vc_row]


Ian
22 Aug 2016Would you have the excel file by any chance. I would be eternally grateful if you could share it with me.
In hope..
Ian
Martin
9 Sep 2016Hello, I’m a student and currently writing my master thesis. I would be really greatful if you could provide me the excel file (or csv) of your data.
Thank you in advance.
Best regards
Martin