[vc_row margintop=”0″ marginbottom=”15″ paddingtop=”0″ paddingbottom=”0″ bg_color=”#ffffff” bg_repeat=”repeat” bg_stretch=”no” en_border=”no” border_color=”#e8e8e8″][vc_column][vc_column_text]
Year 2015 Global 500 – Fortune list is published, it will be great to see how many countries are in the list. Who is fortunate this year? Click to see the last 10 years Global Fortune 500 Database, Charts and Maps. To know about the measuring criteria, cutoff date and quick history about the Global Fortune 500, please visit our 10 years data page about it.
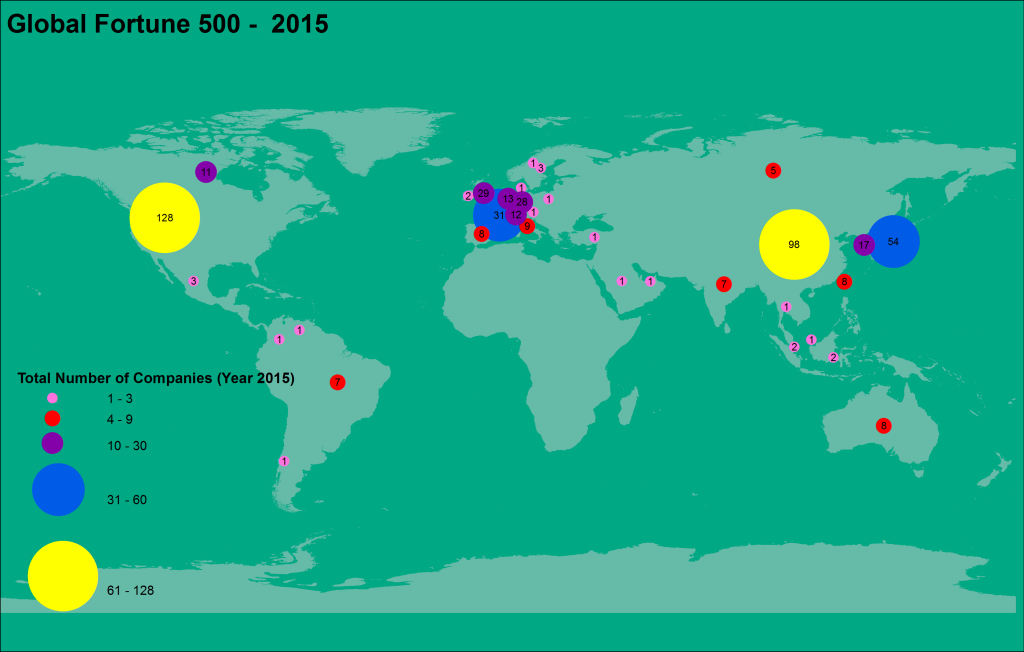
Still the USA is ruling the chart with total of 128 companies and second is China with 98 companies. After that Japan, France, and Britain are in the ranking order. This year the USA total companies are 128 with 2.3 % decrease. For 2014 USA total companies were 131. China added 3 companies with 3.2 % change, for this year total companies are 98 and 95 was for the last year. Britain and Japan also added one company to their list.
[/vc_column_text][vc_separator style=”blank” padding_top=”15″ padding_bottom=”15″][/vc_column][/vc_row][vc_row margintop=”0″ marginbottom=”15″ paddingtop=”0″ paddingbottom=”0″ bg_color=”#ffffff” bg_repeat=”repeat” bg_stretch=”no” en_border=”no” border_color=”#e8e8e8″][vc_column][vc_column_text]The table showing the percentage change:
|
Country |
Total Company (2014) |
Total Company (2015) |
Percentage Change |
|
United States |
131 |
128 |
-2.3% |
|
China |
95 |
98 |
3.2% |
|
Japan |
57 |
54 |
-5.3% |
|
France |
32 |
31 |
-3.1% |
|
Britain |
27 |
29 |
7.4% |
|
Germany |
27 |
28 |
3.7% |
|
Total |
369 |
368 |
-0.3% |
[/vc_column_text][vc_separator style=”blank” padding_top=”15″ padding_bottom=”15″][vc_column_text]
This Year total countries were 36 for the Fortune Global 500 and was same number last year. Malaysia was only the new country to make it to the list and Finland was only country that did not made.
This year total 500 global fortune companies generated $31.2 trillion revenues and $1.7 trillion in profits in year 2014. Global 500 fortune companies employed 65 million people all around the world. For detail data click here
[/vc_column_text][vc_separator style=”blank” padding_top=”30″][ctitle title=”Top Five Company.” color=”#000000″ background=”#ffffff” font_size=”20″][/vc_column][/vc_row][vc_row margintop=”0″ marginbottom=”15″ paddingtop=”0″ paddingbottom=”0″ bg_color=”#ffffff” bg_repeat=”repeat” bg_stretch=”no” en_border=”no” border_color=”#e8e8e8″][vc_column][vc_column_text]
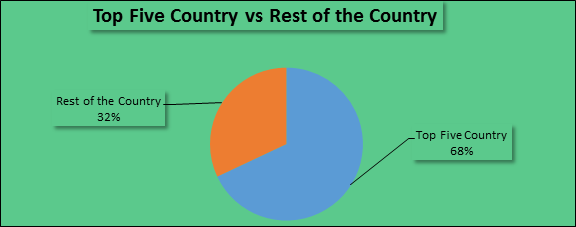
The USA had 38 % out of 340 companies (top 5 total) and 26 % out of 500 companies this year. China as usual 2nd position with 29 % out of 340 companies (top 5 total) and 20 % out of 500 companies.
|
Country |
Total Number |
Out of 340 |
Out of 500 |
|
United States |
128 |
38% |
26% |
|
China |
98 |
29% |
20% |
|
Japan |
54 |
16% |
11% |
|
France |
31 |
9% |
6% |
|
Britain |
29 |
9% |
6% |
|
Total |
340 |
100% |
68% |
[/vc_column_text][vc_separator style=”blank” padding_top=”15″ padding_bottom=”15″][vc_column_text]

[/vc_column_text][/vc_column][/vc_row][vc_row margintop=”25″ marginbottom=”25″ paddingtop=”0″ paddingbottom=”0″ bg_color=”#ffffff” bg_repeat=”repeat” bg_stretch=”no” en_border=”no” border_color=”#e8e8e8″][vc_column][vc_message color=”general”]
Top five country total company make 68 % of the Global fortune 500 list. The remaining 31 countries make 32 %. The Global fortune 500 for 2015 total countries were 36.
[/vc_message][/vc_column][/vc_row][vc_row margintop=”25″ marginbottom=”15″ paddingtop=”0″ paddingbottom=”0″ bg_color=”#ffffff” bg_repeat=”repeat” bg_stretch=”no” en_border=”no” border_color=”#e8e8e8″][vc_column][vc_column_text]
[/vc_column_text][vc_separator style=”double” padding_top=”30″][/vc_column][/vc_row][vc_row margintop=”15″ marginbottom=”15″ paddingtop=”0″ paddingbottom=”0″ bg_color=”#ffffff” bg_repeat=”repeat” bg_stretch=”no” en_border=”no” border_color=”#e8e8e8″][vc_column][ctitle title=”Company by the Continent.” color=”#000000″ background=”#ffffff” font_size=”20″][/vc_column][/vc_row][vc_row margintop=”0″ marginbottom=”0″ paddingtop=”15″ paddingbottom=”0″ bg_color=”#ffffff” bg_repeat=”repeat” bg_stretch=”no” en_border=”no” border_color=”#e8e8e8″][vc_column][vc_column_text]
Asia still top the chart with 198 companies with the gain of 0.5 %. North America has lost one company this year.
[/vc_column_text][/vc_column][/vc_row][vc_row][vc_column][vc_column_text]
|
Country |
Total Company (2014) |
Total Company (2015) |
Percentage Change |
|
Asia |
197 |
198 |
0.5% |
|
North America |
143 |
142 |
-0.7% |
|
Europe |
140 |
142 |
1.4% |
|
South America |
11 |
10 |
-9.1% |
|
Oceania |
9 |
8 |
-11.1% |
|
Total |
500 |
500 |
[/vc_column_text][/vc_column][/vc_row][vc_row margintop=”25″ marginbottom=”15″ paddingtop=”0″ paddingbottom=”0″ bg_color=”#ffffff” bg_repeat=”repeat” bg_stretch=”no” en_border=”no” border_color=”#e8e8e8″][vc_column][vc_column_text]

[/vc_column_text][vc_separator style=”double” padding_top=”30″][/vc_column][/vc_row][vc_row margintop=”15″ marginbottom=”15″ paddingtop=”0″ paddingbottom=”0″ bg_color=”#ffffff” bg_repeat=”repeat” bg_stretch=”no” en_border=”no” border_color=”#e8e8e8″][vc_column][ctitle title=”Map Section:” color=”#000000″ background=”#ffffff” font_size=”20″][/vc_column][/vc_row][vc_row margintop=”0″ marginbottom=”15″ paddingtop=”0″ paddingbottom=”0″ bg_color=”#ffffff” bg_repeat=”repeat” bg_stretch=”no” en_border=”no” border_color=”#e8e8e8″][vc_column][vc_column_text]
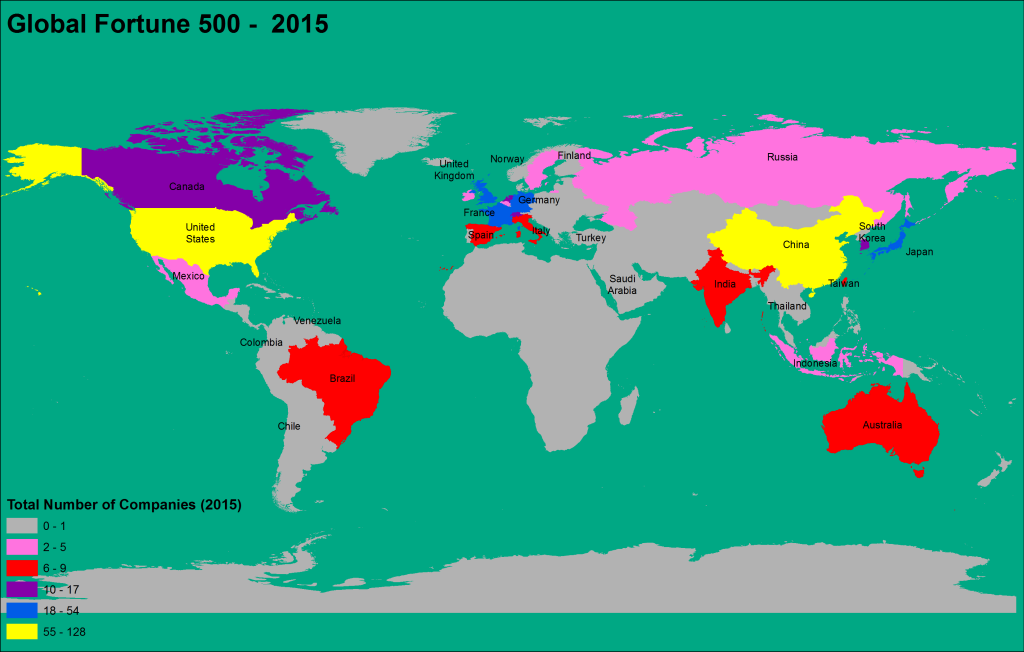
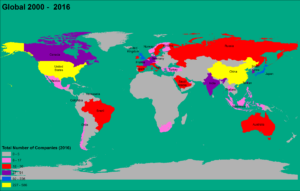
Thematic Map of the Global 500 – Fortune Company for the Year 2015
 [/vc_column_text][/vc_column][/vc_row][vc_row margintop=”35″ marginbottom=”15″ paddingtop=”0″ paddingbottom=”0″ bg_color=”#ffffff” bg_repeat=”repeat” bg_stretch=”no” en_border=”no” border_color=”#e8e8e8″][vc_column][vc_column_text]
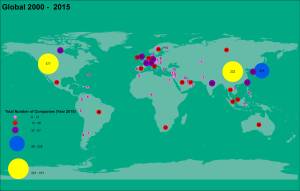
Point and Chart Map of the Global 500 – Fortune Company for the Year 2015
 [/vc_column_text][/vc_column][/vc_row][vc_row margintop=”35″ marginbottom=”15″ paddingtop=”0″ paddingbottom=”0″ bg_color=”#ffffff” bg_repeat=”repeat” bg_stretch=”no” en_border=”no” border_color=”#e8e8e8″][vc_column][vc_column_text]
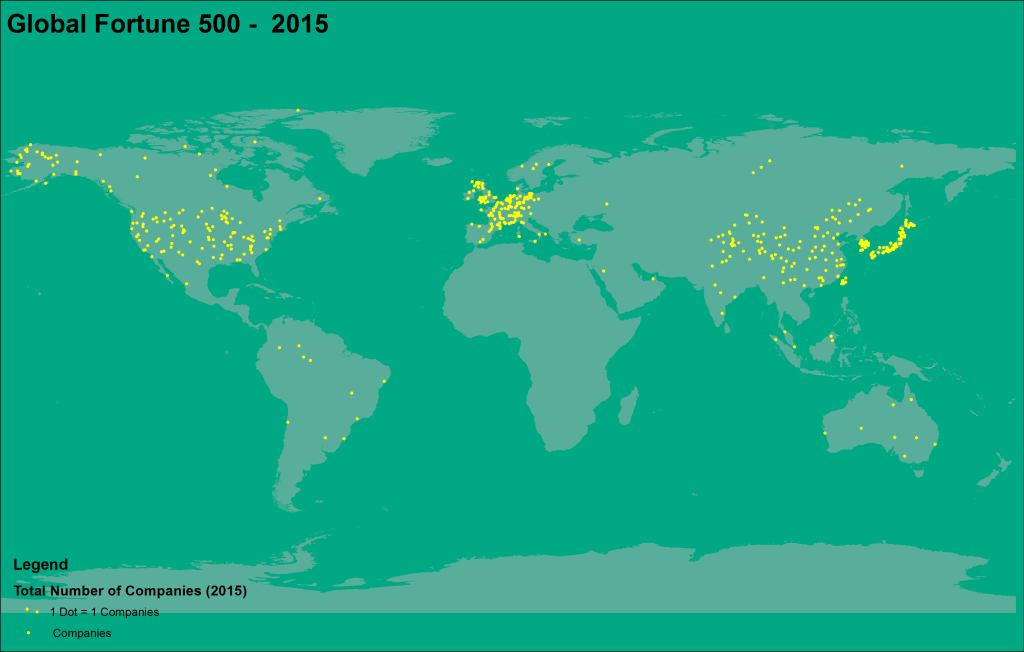
Dot Density Map of the Global 500 – Fortune Company for the Year 2015
 [/vc_column_text][/vc_column][/vc_row][vc_row margintop=”50″ marginbottom=”50″ paddingtop=”0″ paddingbottom=”0″ bg_color=”#ffffff” bg_repeat=”repeat” bg_stretch=”no” en_border=”no” border_color=”#e8e8e8″][vc_column][tagline_box call_text=”NOW READ:” call_text_small=”Mapping of 2015 Public Companies Forbes Global 2000″ title=”Read” color=”blue” margin=”0″ href=”http://grindgis.com/statistics/mapping-of-2015-forbes”][/vc_column][/vc_row][vc_row][vc_column][vc_column_text]
More Resources:
Global 500 – Fortune List
Fortune Global 500 – WIKI
[/vc_column_text][/vc_column][/vc_row]


Charlie Gautreaux
11 Aug 2015Thanks for pulling this together! Have a question for you if you have a minute! Awesome stuff.
admin
12 Aug 2015Thank you for the comment, please let me know.
Pingback: How significant is Fortune 500? | Govmetrics
Editorials Today
21 May 2018Many thanks sir, my utmost appreciation for the hard work of your team, i am a regular visitor to your site indeed, i thought to, (out of courtsey) provide some suggestion and feedback of
my own , would be thankful if you could reply or acknowledge my suggestions to make this website more content focused .
Regards.
Rana Duggal.