
Today I thought I should write tutorial on ArcGIS. I am using ArcGIS 10.3 version but most of the command will be same for lower versions. This simple things if you know on ArcGIS will make you GIS guru. I have picked up simple things that you should know as a GIS person or if you do not know then here is the tutorial. From adding X and Y value to displaying overlapping points.
1. Adding X and Y from Excel Sheet
First create a excel sheets that has your X and Y value. Few things to know about excel and ArcGIS, X is always longitude and Y is always latitude. First row of the excel sheets is read as field name by ArcGIS, so make sure you add appropriate name. I have a sample data below that has X and Y value with their names.
| NAME | X | Y |
| Buenos Aires |
-6502126.00268 |
-4094199.73246 |
| Rio de Janeiro |
-4837408.21016 |
-2581884.52035 |
| Sao Paulo |
-5190037.27600 |
-2685383.30423 |
| Beijing |
12956257.19530 |
4824902.67418 |
| Shanghai |
13522274.23910 |
3642819.35915 |
| Cairo |
3478822.83917 |
3492157.45608 |
| Paris |
270821.69934 |
6222580.17749 |
| Berlin |
1483618.62012 |
6860088.63257 |
| Delhi |
8596577.86402 |
3295110.51921 |
| Calcutta |
9833320.48868 |
2560534.68780 |
| Bombay |
8145508.52201 |
2146339.28036 |
It is a good idea to know the coordinate system of X and Y, so you can assign during the plotting process. This will create projection file when you export the plotted X and Y values.
Note: Just to avoid conflict between ArcGIS and Microsoft excel version, save your excel sheets in 2003 format.
Steps.
-
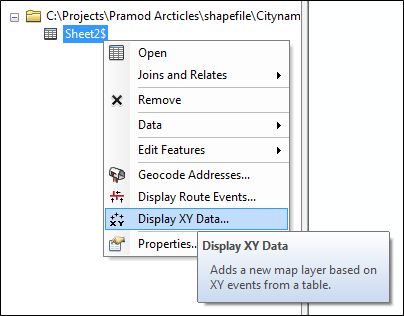
Add the excel table into the ArcGIS


-
Then right click the sheet 2 and click on Display XY Data
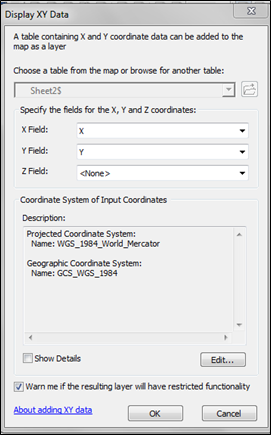
-
If your column name excel in sheet is x and y, it will assign it by default. If you know the coordinate system assign it by selecting Edit button.
2. Creating simple map
Presentation of the map is important and ArcGIS has all the tools required to create maps. In the maps text, graphics, north arrow, scale and map should be kept in appropriate place. They should be well organized, please read my blog where I have listed detail steps while creating map, Checklist to Create a Map in a Well Design Layout
3. ArcGIS Editing Tips
ArcGIS editing tools is advance, here I will show you some basics tools that might be useful while editing.
-
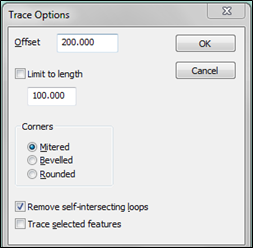
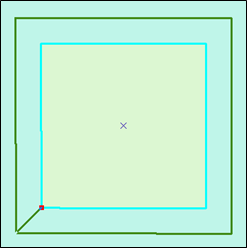
Creating buffer from trace tool, select the trace tool and press O. Now you can assign the buffer distance you want to trace, for example +200 will trace in one direction and -200 will trace in opposite direction. The unit of 200 will be taken according to the coordinate system assigned for that dataframe. If map is in meters and you want in ft, then type 200 ft.

Figure: Trace tool
-
Next is intersecting two lines, this tool is important when you are performing your daily task. From the editor drop down menu > select more editing tools > Advanced Editing. This will add advance editing toolbar into ArcGIS window, select the line intersection tool.
![]()
Figure: Intersection tool
After selecting the intersection tool, click on the first line and then double click on the second line to intersect it. On the below image it will create four segments of line.

4. Plotting overlapping points
Sometime point feature overlaps and you have to show them. So there is a way to show overlapping points, but the coordinates of points will shift bit. On the below image overlapping points are changed so both are showing up.


Overlapping Points No Overlapping
The method used to show overlapping points by labeling features with no color for text label.
First make symbol as no color and no color for width if there is, it should not show any points on the map window.
- Then go to layer properties > labels tab > check label features in this layer. Set label color to no color and then click on the symbol tab.
- Then click Edit symbol > Advanced text Tab > Check Text Background. Then click on the Properties after checking Text background.
-
From the type dropdown menu select Marker text background > click on symbol. Select appropriate symbol to display as a points. After selecting keep on pressing ok till you come back to map window. You will notice overlapping points will show up.
5. Legend, adding text in two or multiple lines
Sometime you have a long layer name that need to be broken down into multiple lines which makes easy and take less space in the legend. The only way to do that is adding the layer name in the description box. Let us say we have a layer name “Population of County in Year 2015, 25000000” and if we show as layer name in the legend then it will take lots of space, so we can broke it down into three lines or stacked them.
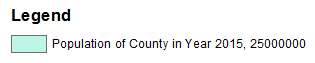
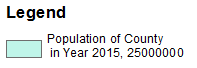
With Layer name plotted With Description plotted
- To do that go to the layer properties> then symbology tab > click Description box
- On the Description box copy the layer name and paste. Then use CTRL + Enter to have multiple lines.


Pingback: 5 ArcGIS Tips helps you to perform you daily job – Geospatial Information Portal
admin
11 Jan 2016Thanks for adding link.
Mohamed Yusuf
14 May 2016i need lesson about archGIS applications
admin
26 May 2016Sure I will write it.