A Heat map is a graphical representation of point data which is used to visualize the diversity of data. Heat map is a best tool to find out the cluster where there is a high concentration. It is also used for Hotspot analysis. It has a wide variety of applications, for example the crime hotspot, traffic clustering or any data concentration.
QGIS is the best software available in the open source market for generating heat map. Heat map plug-in in QGIS is used for creating heat map (density map) which is using a kernel density estimating algorithm. The algorithm creates raster file from the point files (vector). “The density is calculated based on the number of points in a location, with larger number of clustered points resulting in larger values” (QGIS consortium).
Let us create a heat map now. Here I am going to find out the Nacl concentration in wells. We have data from 120 wells.


1: Click on “manage and Install Plug-in” in the main frame of QGIS
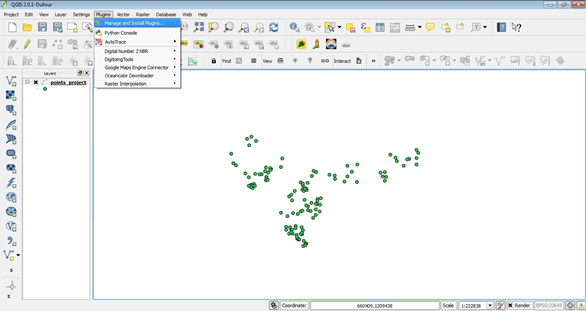
2: Plug-in manager will open
3: Type “Heat map” in the Search tab and activate if it is already installed or Click on Install if it is not installed in your system
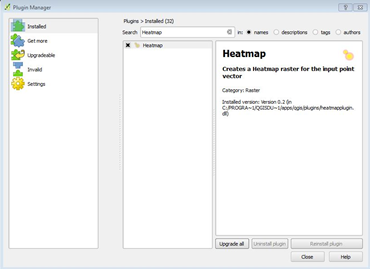
Plug-in manager with heat map plug-in activated
Now Heat map Plug-in is activated
4: Select the “Heat map” Plug-in from the “Raster” in the QGIS main frame
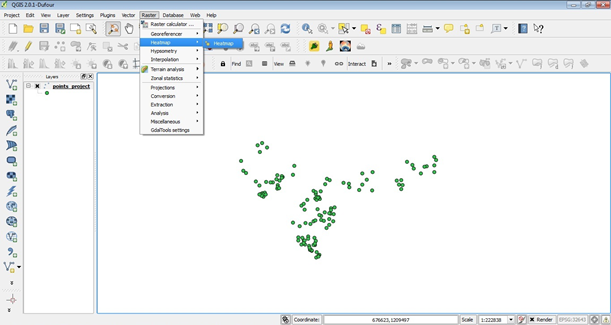
Heat map Plug-in
- Heat map plug-in window will open
- Give the input point file
- Set the output folder and file
- Change the “Radius into 1000 and set as Map unit”
- Give the cell size 100 and
- Press “OK”

Heat map Plug-in window
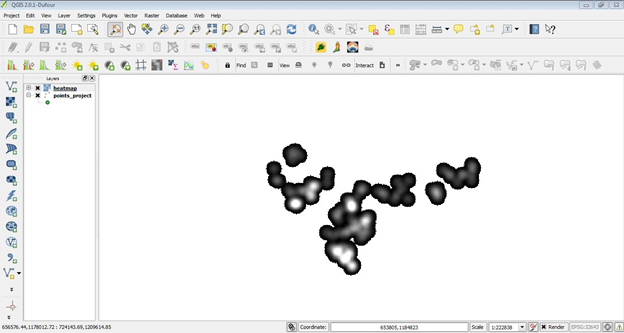
Heat map is created and loaded in QGIS
1: Right click on the “Heat map layer” and select “properties”
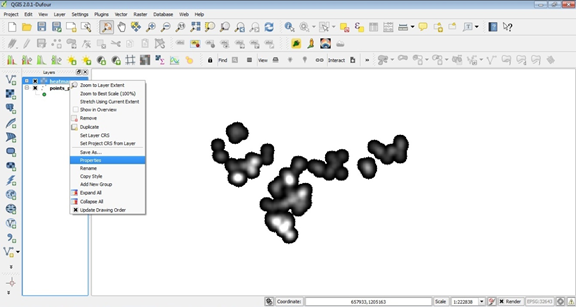
Open the layer properties window
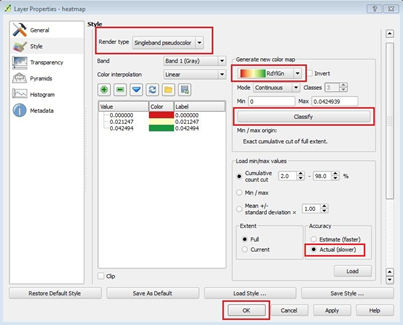
- From the “Style” category Change the “Render type” into “Single band pseudocolor”
- Change the Color scheme as your wish
- Click on “Classify”
- Change the Accuracy into “Actual (Slower)” and Click on “OK”

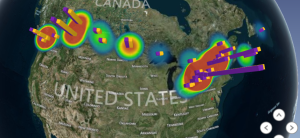
Heat map on color Scheme
Overlay points into heat map
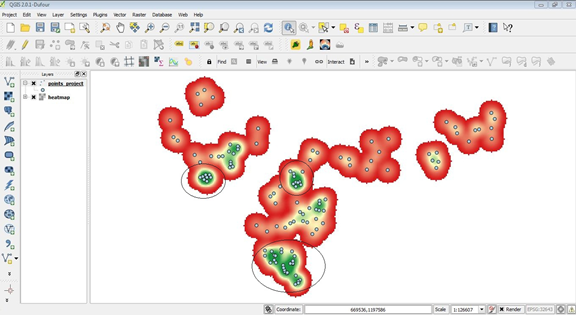
Well points overly on Heat map
Now we can identify the each hot spots/Spatial clusters. Green color shows the clustered wells and has more Nacl concentration among the others.