
[vc_row margintop=”0″ marginbottom=”15″ paddingtop=”0″ paddingbottom=”0″ bg_color=”#ffffff” bg_repeat=”repeat” bg_stretch=”no” en_border=”no” border_color=”#e8e8e8″][vc_column][vc_column_text]
In this tutorial I will talk about the weighted sum overlay analysis in QGIS. Weighted sum overlay is usually done for the suitability analysis. It uses several weighted raster layers for the calculation. GIS uses Boolean logic to perform overlay analysis. This means it uses conditional statements on input layers to generate suitability map.
For each input layer we have to assign the weight value. This weight value is multiplied to the input layer. Then you have to sum all these weighted layers to generate the final output map. Let me give you simple example to identify the soil erosion potential area. The inputs are terrain slope angle and vegetated/not vegetated area. Result will be calculated as “if slope >5% and vegetation=No” then erosion potential = true.
[/vc_column_text][/vc_column][/vc_row][vc_row margintop=”0″ marginbottom=”15″ paddingtop=”0″ paddingbottom=”0″ bg_color=”#ffffff” bg_repeat=”repeat” bg_stretch=”no” en_border=”no” border_color=”#e8e8e8″][vc_column][vc_column_text]
Here we are using weighted overlay analysis to find out ground water potential zones in a river basin using open source QGIS software. Usually this kind of analysis is done using ArcGIS. Unlike ArcGIS, QGIS have certain limitations but still we can do the raster overlay analysis. The inputs are as follows:
- Geomorphology
- Soil
- Land use/ land cover
- Slope
- Drainage
- Lineaments
- Lithology
Some of the layers are vector and they will be converted into raster images. Then all raster layers will be multiplied by the weight value. Following table shows the weight of each layer, total weight is 100. Our aim is to find out the ground water potential zones of the river basin.
[/vc_column_text][/vc_column][/vc_row][vc_row margintop=”0″ marginbottom=”15″ paddingtop=”0″ paddingbottom=”0″ bg_color=”#ffffff” bg_repeat=”repeat” bg_stretch=”no” en_border=”no” border_color=”#e8e8e8″][vc_column][vc_column_text]
|
SL NO. |
Theme |
Theme Weight |
|
1 |
Drainage Density |
12 |
|
2 |
Slope (degree) |
15 |
|
3 |
Lineament density |
16 |
|
4 |
Geomorphology |
21 |
|
5 |
Lithology |
14 |
|
6 |
Soil |
10 |
|
7 |
land use / land cover |
12 |
[/vc_column_text][/vc_column][/vc_row][vc_row margintop=”0″ marginbottom=”15″ paddingtop=”0″ paddingbottom=”0″ bg_color=”#ffffff” bg_repeat=”repeat” bg_stretch=”no” en_border=”no” border_color=”#e8e8e8″][vc_column][vc_column_text]
Process 1: Find out the Drainage Density and Lineament Density
a. Open the QGIS software and add vector layers or “Ctrl+shift+v “ (Key board shortcut)
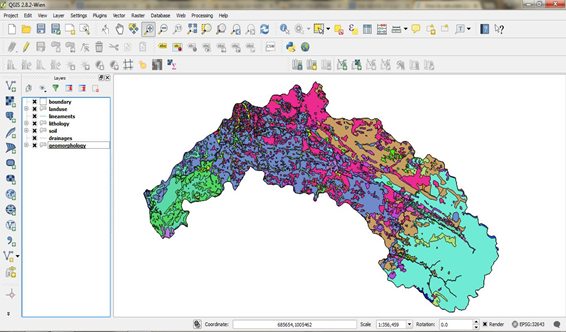
Figure 1: vector files loaded in the QGIS
b. From the main menu select “processing” and click on “toolbox” to activate the processing tools in the QGIS window
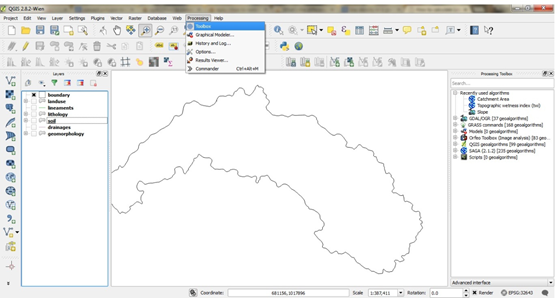
c. From the “Grass algorithms” in the “processing toolbox” select the “V to points tool” for convert line into points. Because to find out lineament and drainage density there is no line density calculation tool in the QGIS, so we can convert them into points and can find the kernel density.

Figure 2: V to points tool from Grass algorithms
When you click on the tool a window will open

d. Set the input line layer as “drainage”
c. Set the maximum distance between the map units as “100”
e. Set the output file name and the folder and press “OK”
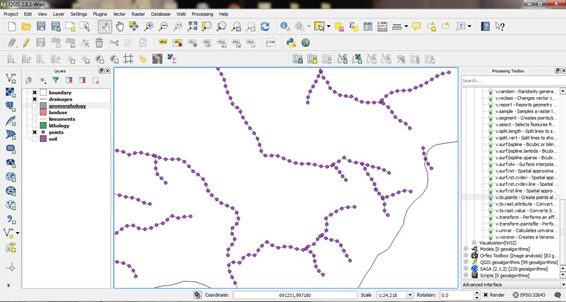
Figure 3: shows the points created along the line
g. Similarly generate the points for lineament also
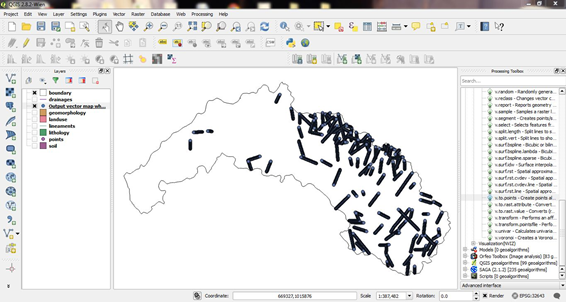
Figure 4: Points generated with lineament lines
h. Click on the “Grass algorithms” and select the “V Kernel tool” to find out the density map
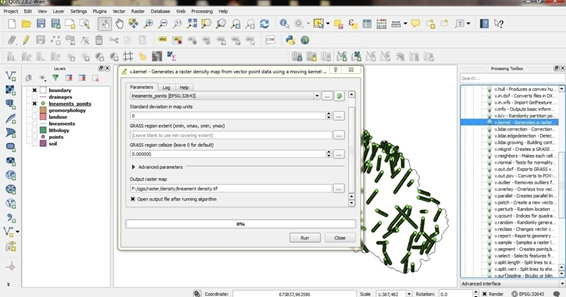
Figure 5: “V Kernel tool box”
i. V kernel tool window will open, set the Input layer name as “lineament_points” and set the “output file name and folder”- press “OK”
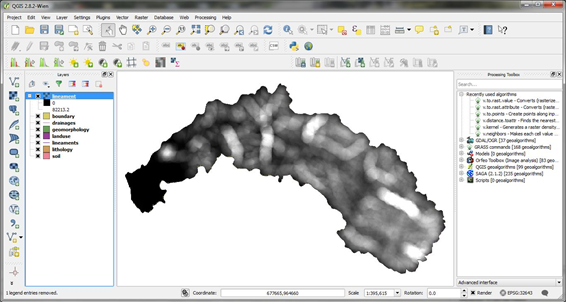
Figure 6: Lineament density
j. Similarly find the drainage density also
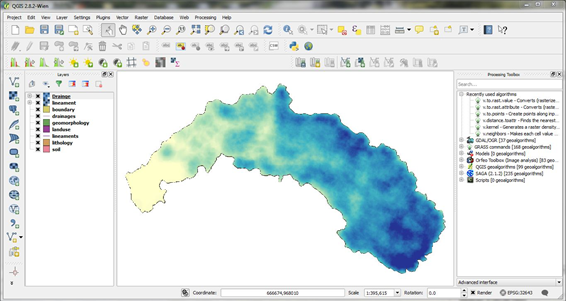
Figure 7: drainage density[/vc_column_text][/vc_column][/vc_row][vc_row margintop=”0″ marginbottom=”15″ paddingtop=”0″ paddingbottom=”0″ bg_color=”#ffffff” bg_repeat=”repeat” bg_stretch=”no” en_border=”no” border_color=”#e8e8e8″][vc_column][vc_column_text]
Process 2: Convert the Vector File into Raster
a. From the main menu select “Raster” –Select “Conversion” and click on “Rasterize (Vector to raster)

Figure 8: Rasterize window
Rasterize window will open
b. Set the Input file “Gemorphology.shp”
c. Set the desired attribute field
d. Set the output file name and folder
e. Click “OK”
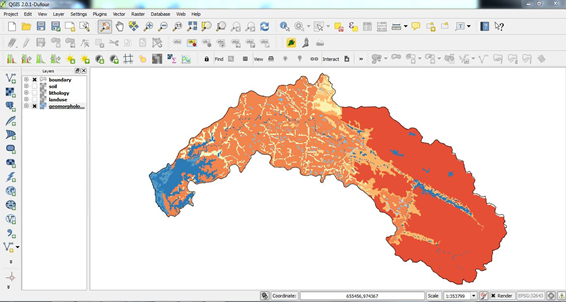
Figure 9: Geomorphology raster is created
f. Similarly rasterize the other themes (Soil, Lithology and land use / land cover)
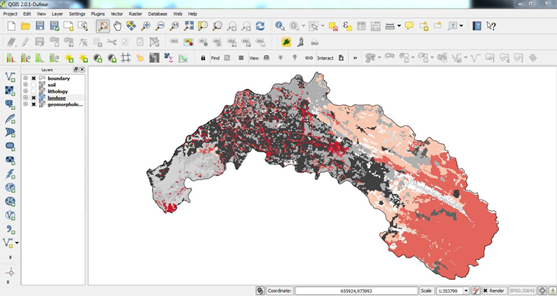
Figure 10: Land use Raster
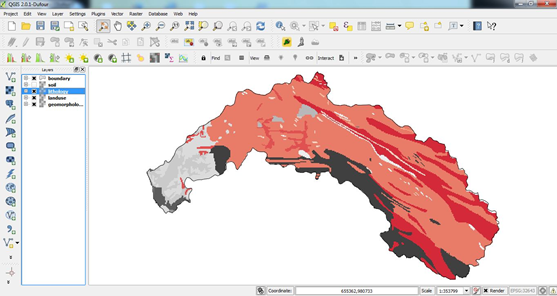
Figure 11: Lithology Raster
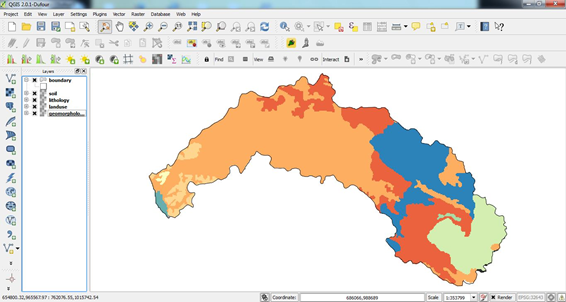
Figure 12: Soil raster
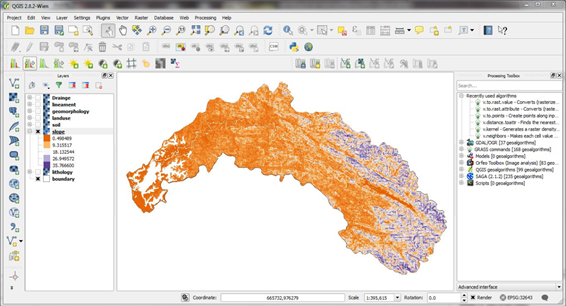
Figure 13: Slope map (Prepared from DEM)[/vc_column_text][/vc_column][/vc_row][vc_row margintop=”0″ marginbottom=”15″ paddingtop=”0″ paddingbottom=”0″ bg_color=”#ffffff” bg_repeat=”repeat” bg_stretch=”no” en_border=”no” border_color=”#e8e8e8″][vc_column][vc_column_text]
Process 3: Ordered Weighted Averaging
a. Select “SAGA geo algorithm” from the Processing tools and click on “Grid Analysis and select Ordered weighted averaging”
( note: if you do not see the tool then make sure you switch to “Advanced Interface” button located at the bottom from “simplified interface“)
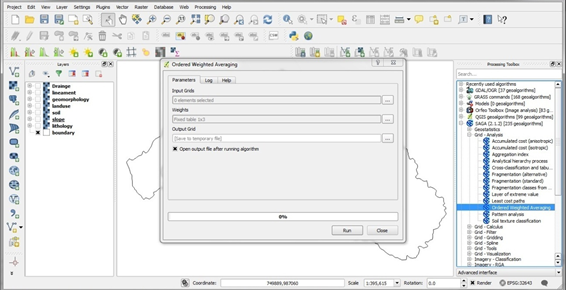
Figure 14: Ordered weighted averaging tool box
b. Click on the “input grids and set the themes example “Soil”
c. Set the weights as per the table we are prepared for soil its 10
d. Input rest of the numbers from the above table
d. Set the output file name and folder
e. Press “OK”
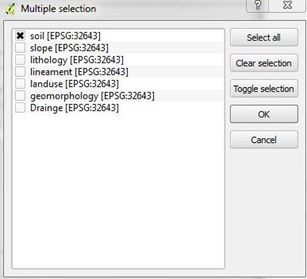
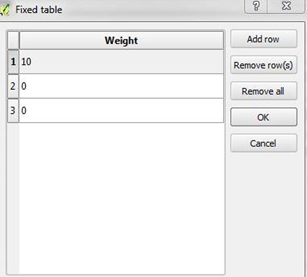
Figure 15 and 16: shows the Input grid selection and assigning weight
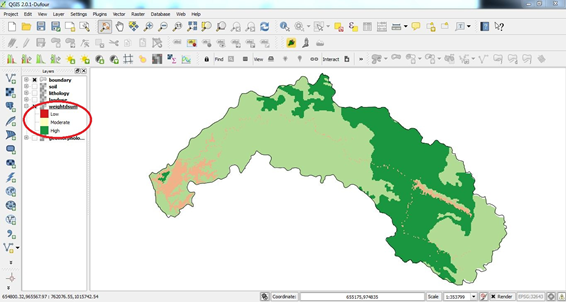
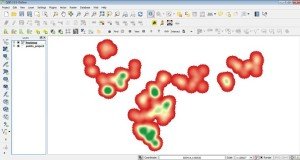
Figure 17: raster overlay analysis result
We found the ground water potential zones
 Green most suitable
 Light green moderate suitable
 Brownish yellow less suitable[/vc_column_text][/vc_column][/vc_row][vc_row margintop=”0″ marginbottom=”15″ paddingtop=”0″ paddingbottom=”0″ bg_color=”#ffffff” bg_repeat=”repeat” bg_stretch=”no” en_border=”no” border_color=”#e8e8e8″][vc_column][vc_separator style=”solid”][/vc_column][/vc_row][vc_row margintop=”0″ marginbottom=”15″ paddingtop=”0″ paddingbottom=”0″ bg_color=”#ffffff” bg_repeat=”repeat” bg_stretch=”no” en_border=”no” border_color=”#e8e8e8″][vc_column][tagline_box call_text=”NOW READ:” call_text_small=”Quick and easy to create Map – Learn basics about the QGIS” title=”READ” color=”blue” margin=”0″ href=”http://grindgis.com/qgis/create-map-and-learn-basics-about-the-qgis”][/vc_column][/vc_row]


UDAY
12 Dec 2016where did u find that data used in this tutorial ?
admin
12 Dec 2016Was written by our guest, may know why?
choudharipp
17 Jan 2017where will i get this sample data which is used in this tutorial. please send or send the link for practice purposes.
admin
18 Jan 2017Thanks, I will…
Harinda
23 May 2019Hi sir, Where can I download this data set
Heisenberg
13 Apr 2017Which version of QGIS was used to perform the analysis. Some of the processing tools are missing in 2.14.1 (LTR)
Thank You
admin
16 Apr 2017Hi, I forget the version but was one and half year ago. Hope that helps
Heisenberg
3 May 2017I have a few doubts I’d like to clarify. Can I get your mail or something? It would be really helpful.
Thank You
Heisenberg
23 Jun 2017I have few doubts, a response would be greatly appreciated
Raju Sukhaye
13 Jul 2017Hello Sir,
Can I please get this sample data which is used in this tutorial for the practice purpose and also steps for the creation of lithological and geomorphological maps. It would be kind of you if you email me the data and steps to my ID.
admin
14 Jul 2017I will see if I still have data available.
Anu raadha
16 Aug 2017I am unable to perform weighted average in SAGA. It says error. Please help. I am doing analysis of ground water potential zone.
Anu raadha
16 Aug 2017Unable to use weighted overlay in SAGA. Gives an error of type_raster. Please help.
Kirthiga
9 Oct 2017Hi, good tutorial!
How can I give ranks for categorical data. For example, if each of my soil class should be ranked before I assign theme weights for the layer. How to do that?
admin
12 Oct 2017Use number to assigns Category.
Kirthiga SM
15 Oct 2017Thanks for the reply. How to input weights for more than three rasters? Only a fixed table of 1×3 is given for inputting weights.
Justine
7 Jun 2018Hi,
I’m trying to use you tutorial to analyse suitability for tourism development. Got an error message saying “”Input layer has more than one band. Multiband layers are not supported by SAGA”. Why did this didn’t happen to you ? Struggling a bit with the logic behind the commands, thank you for your response ! 🙂