
Geographical Information Systems (GIS) allows accurate measurements of and data overlays on satellite-captured images of the Earth and have revolutionized many fields including military, environmental/ecological science, marine and aquatic research and fisheries, forestry, mining, urban and rural development, energy grids, the oil and gas industry and many more. Satellite imaging analysis enables unprecedented acceleration of the identification and characterization of geological, man-made, ecological and geographic features, zones and boundaries as well as detailed modeling of water runoff. Most of these abilities can also be automated through machine learning modules which enable labor-saving for large-scale survey projects covering vast areas of land. The geographical perspectives offered by GIS technology are critical to all phases of Oil and Gas production, reducing the cost in terms of time and resources and improving the accuracy of planning.
With a GIS application, companies in the oil and gas industry can correlate spatial data with other metrics to search for geological features that indicate the likely presence of fossil fuels. Whereas in the past, this kind of exploration would have been conducted by plane or even by overland expedition at significantly greater cost, much slower rate and with less ground covered. Modern satellites are even capable of visualizing terrain in infrared and UV! Overall, GIS software enables smarter, faster early-stage decision-making in oil and gas exploration.
Identifying and monitoring natural and manmade features in areas where drilling is to occur is extremely important in the oil and gas industry. This enables not only efficient exploration but also planning of drilling infrastructure that maximizes profit and minimizes cost as well as minimizing endangerment of local ecology, agriculture, water infrastructure, aquifers and surface waters. GIS also aids the planning and monitoring of post-operation clean-up and remediation of drilling sites.
Note: To find out more about GIS applications in other industries, you can visit EduZaurus and get a more complete perspective of this powerful technology. Some of the advantages of using GIS applications include:
-
The Creation of custom layers of data which are displayed on top of up-to-date satellite maps
-
Ability to make accurate, easy measurements of lengths, areas and volumes of complex structures, useful for logistics as well as for planning and estimates.
-
Enabling the visualization of proposed oil and gas pipelines over the geographical area so as to better understand the environmental risks and visual impact of the infrastructure to surroundings areas and to assess the security risks to the facilities.
-
Creation of commonly accessible and easily updated maps that enable multiple teams to coordinate and share information.
-
Rapid dissemination of information throughout the organization via labels and annotation function aids maintenance and repair efforts and response times to infrastructure issues such as leaks.
-
Combination with survey drone technology opens fast, cost-effective remote inspection and monitoring options for oil and gas infrastructure.

Now that we have identified the advantages of using GIS in the oil and gas industry, you might be interested to learn specifically about some of the most recommended GIS software suites and their outstanding features.
1. ArcGIS
A staple of ecological scientific research and perhaps the most established, developed and therefore leading GIS software in the world, ArcGIS offers unparalleled functionality for the coordination of people, processes and technology for the operations across the natural gas and the petroleum industries.
Through the implementation of modules for global mapping, reporting/annotation and the analytics suite, ArcGIS enables everyone to make maps, explore and leverage spatial data and information and enables advanced and even automated analysis processes. ArcGIS sets itself apart from the rest of its competitors through is its extensive data-driven analytics toolset, which is constantly being updated and allows for advanced statistics and automated image analysis using machine learning which can be taught within ArcGIS modules using manually created maps as training material. Through a data-driven styled analysis, ArcGIS facilitates truly professional-level functionality which helps deliver location intelligence to everyone of your partners. It is truly a tool for global enterprises, yet can be accessibly used by small research teams and individual as well.
Lastly, ArcGIS is accessible online in a web-hosted form which can be accessed from anywhere in the world. That means that stakeholders or colleagues in your organization do not need to install the ArcGIS client on their computers to enjoy its benefits. All they have to do is access the ArcGIS online portal and sign in with their usernames and passwords to view all the information you’ve shared with them.
However, ArcGIS is only free for noncommercial use and has various feature packages for purchase. A subscription is required to access all the functionalities of the software. The benefits, however, far outweigh the subscription cost of the application. It is not an overstatement to say that ArcGIS has or will shortly have all of the features available in the GIS world. Additionally, learning GIS is a very marketable skill in many industries.
1.1. ArcMap
ArcMap is a proprietary GIs system that serves as the main component of Esri’s powerful ArcGIS suit. It runs the core application for geospatial data processing which allows the user to view, manipulate, create, and visualize geospatial data. The program allows for the inspection and manipulation of data and consequent map creation based on the dataset. Since it is a single component of the ArcGIS software, ArcMap comes with a relatively inexpensive price tag.
2. ArcView 3.X
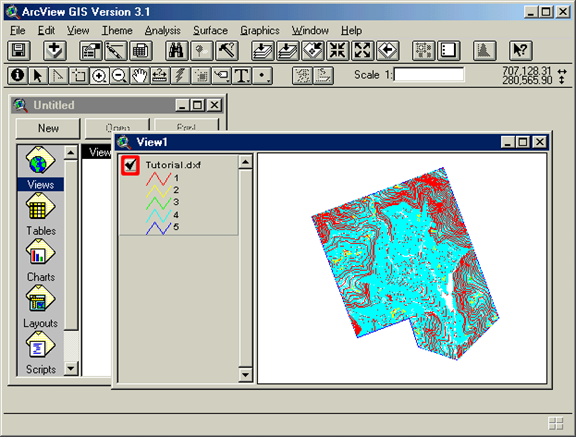
ArcView is proprietary software created by the developers behind ArcGIS as an entry level software. It is a desktop-based application designed to offer basic data visualization, editing, and creation functionalities. Although it lacks the ability to monitor remote assets and manage different aspects of the oil and gas industry value chain, it does make an excellent choice for users who are just starting out in GIS applications. If you want to learn how to use GIS, ArcView is one of the best starter software and has similarities to the more advanced and industry-leading ArcGIS.
3. QGIS
QGIS offers the ability to simulate geospatial data to everyone. It is an open source alternative to subscription-gated GIS software and is appropriate for use by the oil and petroleum industry. While the interfaces and learning curve can be more challenging on open source software, QGIS delivers all the best features of proprietary software under a free-to-use license.
The latest iteration of QGIS allows for the simulation of landscapes in 3D which is important for mapping underground reservoirs for the petroleum and gas industries. 3D map visualization, through native 3D rendering, allows for the transformation of data and visualization for better assessment of various landscape features.

Image source: boundlessgeo.com
Moreover, QGIS brings maps to life by offering a large array of tools for cartography. If you want to construct truly breathtaking maps, QGIS is the best GIS software for the job. By allowing access to parameters such as Alpha slider which manipulates the transparency settings or the color ramp widget for customizing colors for each widget, you can use the myriad of features to really emphasize that which you are interested in on a given GIS map.
Another feature that makes QGIS a favorite in the petroleum and gas industry is its speed. The application allows the user to zoom, pan or load features on a map in the blink of an eye. That makes it the fastest GIS software in the entire industry, even when it is fed with large geospatial data. It also renders a map in the fastest time compared to other GIS packages.
QGIS also allows for manual placement of labels. That means that when you encounter situations where labels overlap, instead of using the traditional approach for generating annotations for each label or altering the layer’s placement settings that are often cumbersome, QGIS allows for the manual placement of labels. The software allows the user to override the smart label placement frequently touted by other GIS software. Users can then hide, shift or style an individual label however they see fit. The annotations in QGIS are also unique in that they adopt a minimalistic approach where users have complete control over them.
Another unique feature of QGIS is the ability to preview coordinate reference system bounds. The functionality allows users to ascertain that they have the right coordinate systems by previewing their valid bounds. Therefore, regardless of the map location you enter, QGIS allows you to validate its location using pre-configured GPS coordinates.
Another feature that makes QGIS the go-to software for GIS application in the oil and gas industry is the fact that it create its output files in the geopackage format. This means that files developed through QGIS can be anything from extensions, vector tiles, layer attributes and even rasters. The geopackage format makes file sharing easy since everything is located in a single file.
Another useful feature of the QGIS package is its ability to segregate tasks for background processing. Not many GIS software can claim this ability, setting QGIS in a category of its own. With background processing, the software allows you to work on other tasks while number crunching occurs in the background. Therefore, your workflow never gets interrupted when you run QGIS.
With so many features, you may worry that QGIS is a complex software, especially for the untrained users. There are certainly many features to learn, though thanks to a large, active user base and many online guides and video tutorial for the program, getting up to speed is not as painful as reading developer notes and clicking through options and features. Ultimately, the software has a reputation as being one of the most flexible, intuitive and easy to use in the market once proficiency is gained.
Another staple of the oil and gas exploration industry is MapInfo Professional, a proprietary desktop GIS software maintained by Pitney Bowes Software. Given that MapInfo Pro is a dedicated desktop application, its speed in both executing commands and performing tasks is quite commendable. Its powerful set of features and capabilities such as data creation, editing, sharing, GIS raster analysis, location intelligence, multiple visualization options, and complete data compatibility makes it an extremely compelling choice for many companies in the oil and gas industry.

Image source: youtube.com
There are several other reasons why users prefer MapInfo Pro. First, the software package is easy to use and comes bundled with the ability to track down prospects and manage different tasks from the same dashboard. That means a MapInfo Pro user enjoys the freedom to work on different aspects of the same project from the same interface. The ease of use is further enhanced by an ability to customize keyboard shortcuts and the automation of common tasks which expedites any project. What’s more, MapInfo Pro comes with the MapBasic functionality that allows for the realization of custom solutions complete with custom ribbons and tabs for each project.
The ribbon-based navigation makes MapInfo Pro intuitive. First-time users can easily navigate and even complete basic projects without referring to a manual or asking for help. In time, users are able to navigate to almost effortlessly around the software, access the quick click dropdown menus, and even take advantage of the gallery controls.
The easy-to-use interface is coupled with powerful features which make it easy to create rich maps. These features allow users to combine data, base maps, and analytics that represent the insight necessary to make decisions in the petroleum and gas industry. These functionalities are not available in standard charts and spreadsheet applications commonly used in GIS.
The raster GIS analysis feature bundled with MapInfo saves the user a lot of time when it comes to analyzing markets and aggregate values, all of which are important for the identification of opportunities. Therefore, using MapInfo Pro can help a company identify opportunities faster than the competition, which is a significant competitive advantage in the industry.
MapInfo Pro does have a chink in its armor though. The application’s map visualization program can appear cluttered at times making it hard for first-time users to discern the desired information. While it takes time to get used to the map visualization in the software, once a user gets the hang of it, it becomes intuitive and easy to take advantage of the many features that are offered by the software.
5. MapServer
As an open source GIS platform, MapServe offers an easily accessible way to edit, draft and manage map files. The software is available on all major platforms including Linux, Windows, and Mac OS.
As the official website points out, MapServe is not a complete GIS system. Given that, you may be wondering why then is MapServe included in this list. While it doesn’t aspire to be a complete GIS system, MapServe features a good range of tools for enhancing and editing maps in a light, clutter-free and streamlined package. This makes it a good accessory tool for field work or quick draft-ups and for sharing maps as simple image files.
6. GRASS GIS

Image source: grass.osgeo.org
Also known as Geographic Resources Analysis Support System, the GRASS suite offers the ability to analyze and manage geospatial data, process images, and visualize maps in a single interface. The software package also provides support for spatial and temporal modeling that handles rasterization, topological vectoring, and image processing, elements which are vital for the oil and gas industry. The software is available under a GNU license meaning everyone can use it without paying for a subscription.
7. SAGA GIS

Image source: zlatko-horvat.com
Another free-to-use GIS application for the petroleum and gas industry is SAGA GIS. Also known as the System for Automated Geoscientific Analysis, SAGA GIS comes with the capability of editing spatial data, processing geodata, and map analysis. The software was developed with the C++ language which opens the door to writing custom modules and integrating it into other same-platform workflows.
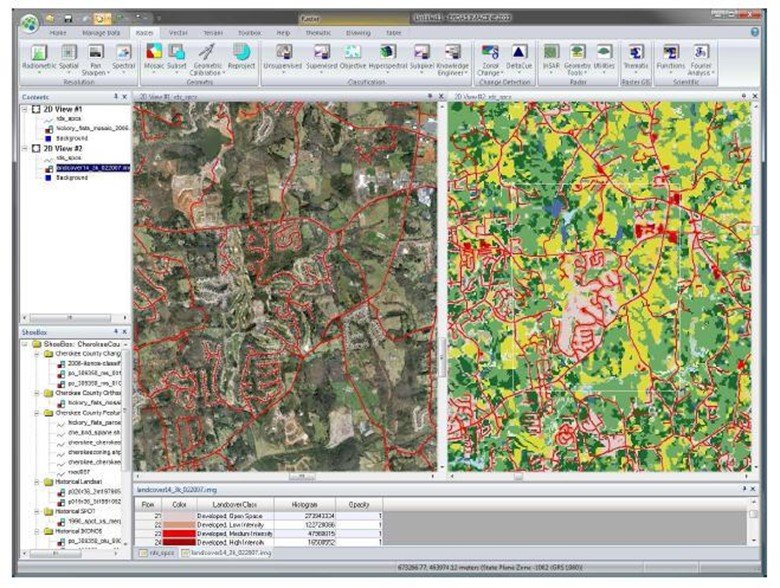
8. TerrSet
Clark Labs provides the TerrSet software which is an integrated GIS system and remote sensing software. It provides refined functionality for the analysis and display of geospatial data as well as the monitoring of different points in that data. The software runs on the Windows operating system which may limit its application for infrastructures that primarily rely on other operating systems.
9. PostGIS
PostGIS is a free-to-use GIS software that primarily uses the PostgreSQL object-oriented database to store geospatial data, conforming to the standardized format established by the Open Geospatial Consortium. It is, therefore, a GIS extension of the PostgreSQL database for the creation, editing, and visualization of geospatial data. Petroleum and gas industry companies that use PostgreSQL in their infrastructure can greatly expand on the capabilities of PostGIS.
10. JUMP GIS
JUMP GIS is a Java implementation of a geospatial information system that is free to use. The software suite continues to receive numerous updates and some functions are in the process of being added. However, it is capable of typical GIS functions: creating, editing, and visualizing geospatial data. If a company possess programming expertise, it can build on the framework and create a fully-fledged GIS software custom made to meet its specific requirements.
11. ILWIS GIS

Image source: geographyinformationscience.blogspot.com
The Integrated Land and Water Information System (ILWIS) is an open source GIS software that enables not only the manipulation of geospatial data but also remote sensing and monitoring of geospatial hardware. It provides both vector and raster processing which allows users to digitize, manipulate, analyze, and visualize data to produce industry standard maps.
12. Whitebox Geospatial Analysis Tools
This open source solution for geospatial data creation, editing, analysis, and visualization includes a slew of tools that enable remote sensing of assets in the field and management. According to the official Whitebox Geospatial Analysis Tools website, the software suite allows users to experiment with novel geospatial analysis methods. The feature makes it a useful tool for an oil and gas company looking for new ways of manipulating geospatial data and assets.
14. Manifold System
Developed by Manifold Software Limited, the Manifold System GIS software offers the typical capabilities of creating, editing, analyzing, and visualizing geospatial information. Additionally, the software allows users to build both vector and raster data using spatial SQL, which is an Internet Map Server that runs on Microsoft Windows.
15. AutoCAD Map 3D

Image source: youtube.com
AutoCAD, a popular tool for creating visualizations and models, has a GIS module that allows users to create models based on GIS mapping. The software provides support for planning, designing, and visualizing geospatial data primarily on the Windows platform.
16. FalconView
The mapping system created by Georgia Tech Research Institute is intended for the Windows operating system. There are, however, versions that support Linux and mobile operating systems which are currently under development. FalconView primarily supports the visualization of maps and geographically referenced models generated from geospatial data.
17. GeoNetwork
As an open source project, GeoNetwork is primarily a cataloging application for geospatial data. It serves as a repository for spatially referenced resources and includes a list of location-oriented information. It offers the capabilities of metadata creation and management, as well as basic web-based mapping features.
18. GeoTime
GeoTime is proprietary software that assists in the analysis and visualization of events generated from geospatial data. It is one of the few software suites that features temporal visualization of changes in geospatial information. Therefore, users of the platform are able to compare changes occurring within a series of data over time. This, combined with the rendering of 3D maps, creates impressive effects for mapping phenomenon such as erosion, glacier behavior, deforestation and reforestation, construction progress, seismic activity, weather and more!
19. Geomedia
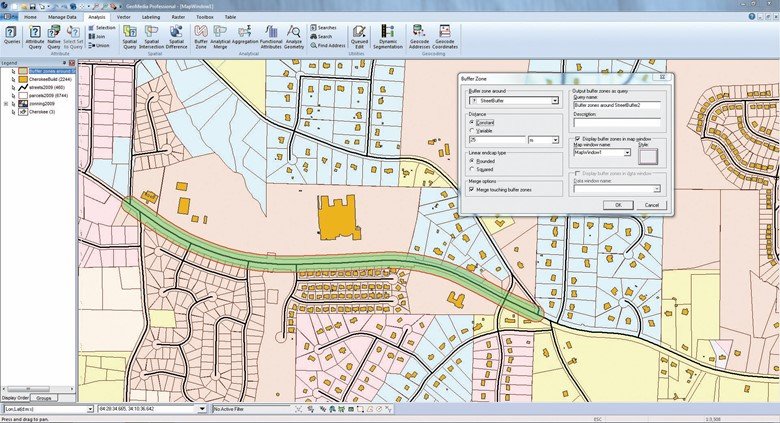
Image source: www.g2crowd.com
As a proprietary system, Geomedia rivals the functionalities and capabilities offered by ArcGIS. For the Petroleum and gas industry, this is good news because Geomedia offers an alternative to ArcGIS’s capabilities and functions. The software employs a data-driven approach that enables visualization, data management, and analysis through cartographic tools.
20. Global Mapper
Originally developed for the USGS, Global Mapper evolved into a commercial software that is specifically designed for oil and gas exploration. It is considered as the Swiss-army knife of GIS programs for geospatial data analysis and visualization because it offers the newest and most advanced capabilities that industry clients require. It of course supports 3D rendering, watershed delineation, and LiDAR handling.
21. General Electric Smallworld
Designed for industrial use, General Electric’s Smallworld GIS package allows tech-savvy users to manage, design, and plan large infrastructure projects for the oil and gas industry. The software offers invaluable resources for efficiently designing and monitoring infrastructure for the transportation of gas and petroleum from drilling sites to refineries.
22. Bentley Map

Image source: youtube.com
Bentley fuse Computer-Aided Design with GIS technology. The platform provides a versatile venue for the creation and visualization of 2D and 3D rendering of geospatial data. The fly-throughs in the software allows for clash detection and intersections that make it easy to simulate infrastructure and models on a map.
MapViewer and Surfer are a highly regarded suite of commercial GIS applications for meet numerous geospatial data needs. The Surfer component allows for immediate contouring, grinding, and surface rendering through a host of cartographic tools. Data can be transformed to create detailed 3D, as well as wireframe and vector-scale maps. The MapViewer component allows the user to publish and share professional-quality maps.
24. Maptitude
Developed by the Caliper Corporation, Maptitude is an easy-to-use GIS application with a decent range of features. It allows users to develop maps with quickly, has an easy learning curve and enables company publish detailed maps to aid its oil and gas exploration efforts. It is capable of handling large geospatial datasets and is suitable for identifying geological features and patterns.
25. SuperGIS
Supergeo Technologies, the company behind SuperGIS, enables fast processing of geospatial data. Its interface and capabilities are very similar to those found on ArcGIS including on-the-fly web-based access and shared project editing as well as extension options. It is worth noting that the toolchain offered by SuperGIS are faster than those offered by ArcGIS, which offers advantages to users who expect to regularly process large data sets.
26. IDRISI
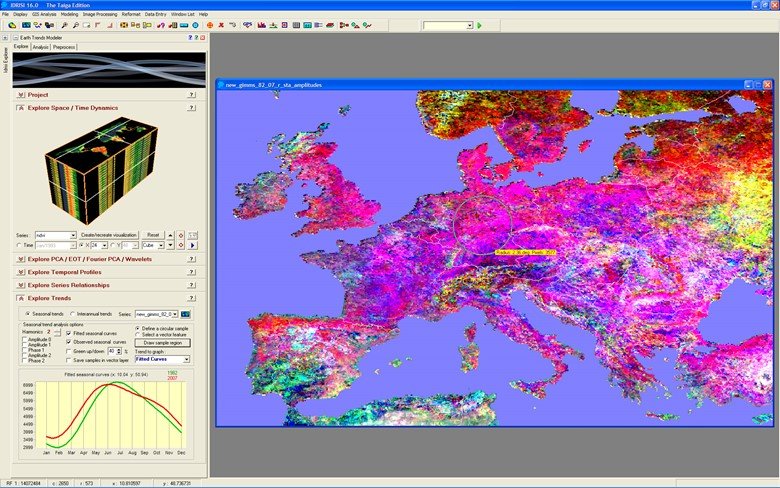
Image source: wikipedia.org
IDRISI is a GIS software solution developed by Clark Laboratories that features remote sensing its area of excellence. The software also makes a name for itself with more than 300 GIS processing tools dedicated towards raster processing. It also supports add-ons that add functionality to the core IDRISI software. The oil and gas industry greatly benefits from this capability as companies can develop their own custom add-ons to solve customs problem.
27. TatukGIS
While the TatukGIS Viewer is free to use, the upgraded version of the software allows for geospatial data editing, scripting, and mapping, accessible with a subscription. It offers state-of-the-art functions such as error checking and on-the-fly projections covering over 900 data points.
28. MicroImages
The MicroImages suite consists of a slew of applications including TNTmips, TNTview, TNTedit, and TNTscript. The viewer in MicroImages, the TNTview may appear as a barebone GIS viewer, but there is more under the hood than meets the eye. The software has advanced options that include 3D viewing and stereo viewing. It can also be used to design maps featuring thematic cartography.
29. MapMaker Pro
To make maps for the petroleum and gas industry, users benefit from the ability to manipulate 3D maps, insert GPS data, develop vectors and display data in raster format. MapMaker Pro offers these features and is a low-cost solution for the creation of maps that detail the entire oil and gas value chain.
30. Xmap
Another inexpensive and user-friendly comprehensive package, XMap allows for the collection of data, its analysis, manipulation, and visualization to meet the objectives of most oil and gas exploration company. It can also be used for the management of geospatial data, and it can fully integrate with ArcGIS.
Paul
3 Oct 2018Is the link to EduZaurus in the 4th paragraph a typo?!? Could you include links in each entry to the homepage of each product so we don’t have to google each and every one? Thanks otherwise for the interesting list.
admin
3 Oct 2018Thanks for the comment, I will comment that out.It is a guest post so has to give one link to them.
Anna
10 Jun 2019My name is Anna, I am the PR coordinator. I`m representing the company EOS LAND VIEWER.
The LandViewer application is an online GIS-assistant which provides a real-time remote sensing data analytics.
I would like to discuss the possibility for cooperation with your portal.
We have prepared several topics of articles. We hope it can interest your editorial board for publication.
Topics are presented below:
1. Satellite Earth Data Analysis as a tool for reducing the effects of forest fires.
2. What kind of instruments helps to monitor the dynamics of forest fires.
3. Interview with the project manager
We are also open to your proposals for cooperation. What topics might interest you? What topics were interesting for you to provide materials?
Also, would you like to clarify with you the terms of publication on your resource?
What are the requirements for publications?
I would be very grateful for the feedback.
I hope to establish a partnership.
newme
7 Feb 2020hello
is their a GIS software that have similar or better functionality than GeoTime?
please give me a hint.