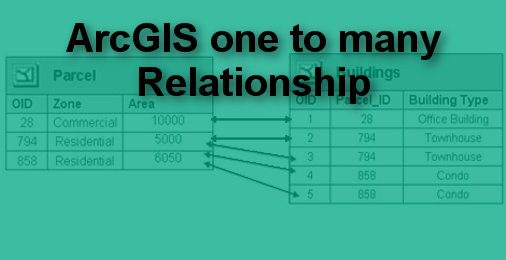
It has been while I have not written any blog due to my tight schedule. I thought to start blogging again as my work load has decreased. This week at work I was facing some challenges in the ArcGIS to label field from attribute table and excel sheets. The challenges was same polygon have more than two values and have to plot all the multiple values. ArcGIS Join tool pull only the first value and rest is ignored. It is the case of one to many relationship. Join tool allows only one to one relationship. So there is a way to plot multiple values without writing a code. I have attached VB script to do that as well. To perform this task first you have to relate the table, then join the table, and finally label it.

Note: This is only possible for files in same geodatabase, so create the geodatabase and import your shapefile and excel sheets in same geodatabase. But if you want to label from shapefile and .dbf tables then you can use VB code that is shown below. Enjoy the tutorial!

Process: Relate > Join > Label
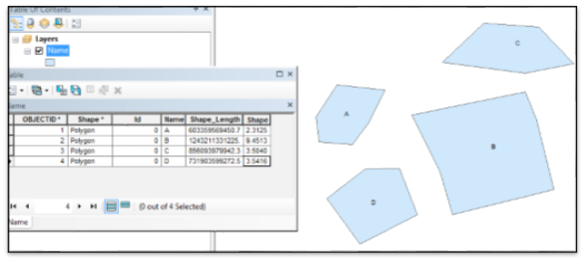
For this project I am creating feature class with four attributes A, B, C, and D. See below image for attribute values.
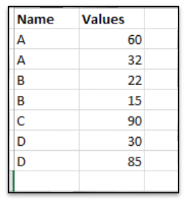
Also, you have values from the excel sheet for attribute A, B, C, and D and you want to plot all the multiple values.
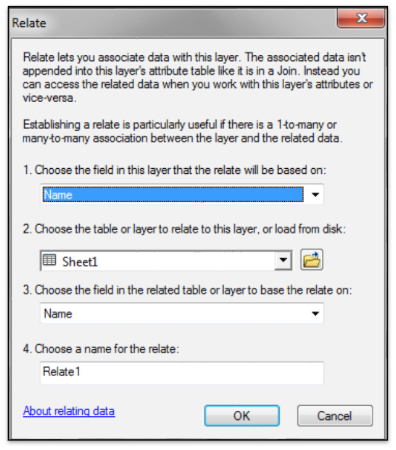
1. First step you have to do is save the excel file. Note, lower version of ArcGIS might only accept older version of excel file, so you can save it on 2003 format. Then import that excel sheets into the geodatabase where your feature class is sitting. Once your excel file is imported then first Relate it.
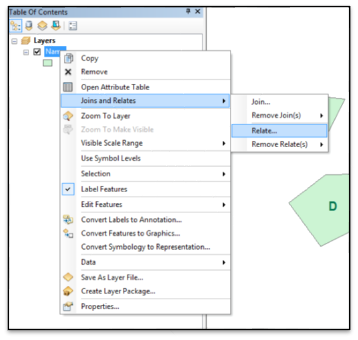
2. Now you assign the field to relate, in our case is the Name. Then browse your imported excel file in the geodatabase and select it, then assign the relating field from the drop down menu. In our case is again Name. On the last option give the name of the relationship. After all the assignment, press Ok to relate the excel table.
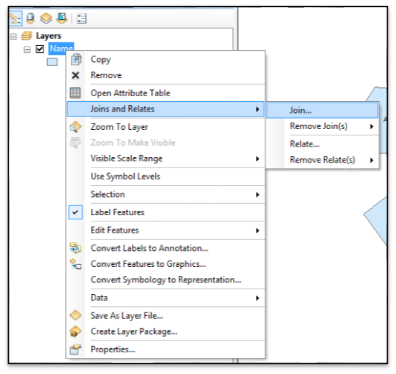
3. Now Relationship is done, next process is to join. Note: to verify your relationship you can use identify tool which will show both tables values. To join the table click on the Join button.
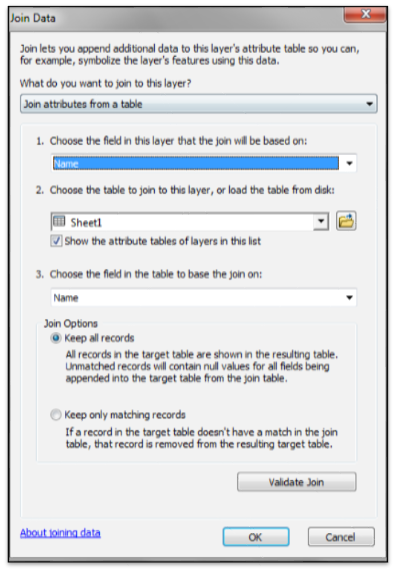
4. On the join opened window, assign Name as a joining field. Again, browse the saved excel sheets and select Name as join to field. Then press Ok button to join the table.
5. Now the last process is to label, for that click on the layer properties and select the label tab. On the label field assign values_1
in our case.
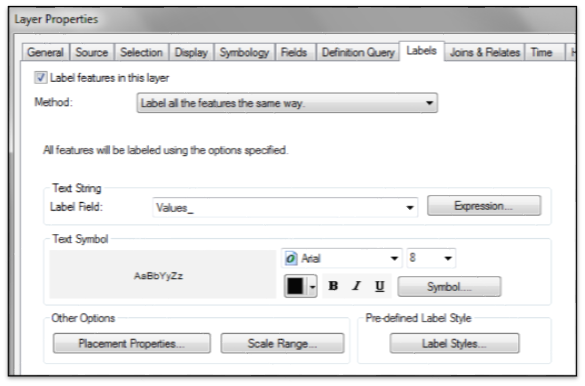
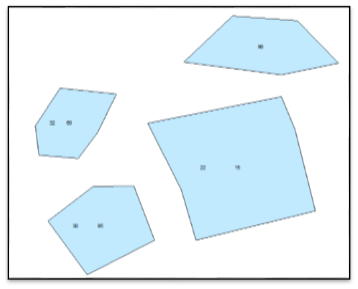
6. On the map all the related values will be plotted. See the output image below.
How to do using the VB Script in ArcGIS.
Open the Arcgis properties, then click the label tab and then click on the Expression button.
1. Check the Advanced tab and make sure you have selected Vbscript
as a parser.
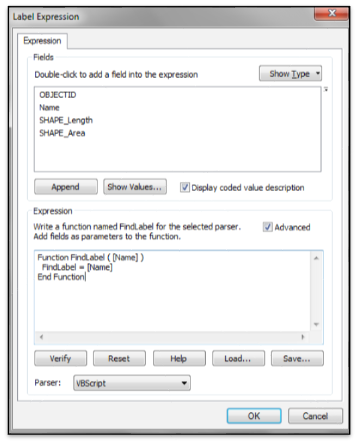
2. Delete the existing code and paste the below code. But read below steps to assign your values.
|
Function FindLabel ( [feature class field name] ) |
Note: if you add your tables into the ArcGIS you do not have to assign the path, just type the name of the table but it should contains geodatabase name in the front ( you will find your table name in the source tab if you open layer properties), code source is from https://gisnuts.com
Let us say, you have feature class called parcel and you want to join through field name called parcel id. Also, you have table called tablejoin to merge with parcel layer through parcelid1. Replace the value in above code as below then:
| feature class field name: | parcel id. |
| Related table field name: | parcelid1 |
| Path to the table: | C:/gis/tablejoin |
| LabelField: | Field you want to label it. |


Evord Kimario
19 Apr 2016I kindly need your help, i went through all the process by creating a personal geodatabase, and import the shapefile and my excel file into that geodatabase. performed a relate followed by a join, but when i label by using one of the attribute in my excel sheet the related values are not ploted
admin
19 Apr 2016It should work like that, first you relate and then join, and finally label it. that is the process, try converting excel sheets to dbf file and then import to geodatabase. Let me know how that works? if not send me your file and everything, I will try at home to do it. Thanks
Evord Kimario
19 Apr 2016Thanks a lot for the reply, i am still stuck. Can i get your email so as i can send my files to you?
Evord Kimario
19 Apr 2016which kind of geodatabase did you use, File geodatabase or personal geodatabase? i used both of them and nothing happened. I also tried to convert the excel file to dbf file.
I am using ArcGIS 10
admin
19 Apr 2016I used Arcgis 10.3 to perform. I have send you blank email. Check your email
admin
20 Apr 2016Check your email, your excel sheet has some issue. Thanks
admin
26 Apr 2016This is message from Evord, Thank you for finding this.
“As i told you i have ArcGIS 10.0, now i tried the exercise to my friend with ArcGIS 10.2.1 and it worked.
You should add this to your manual that it agrees to arcGis 10.2 and above. Although i haven’t tried with 10.1, you have check on that”