[vc_row][vc_column][vc_column_text]
There are tons of story telling maps in the internet, I just picked the ones that I think you guys will like it. I like to give credit to the Amazing Maps group in the twitter from where I filtered out maps. These are my best 20 maps of the United States of America.
[/vc_column_text][/vc_column][/vc_row][vc_row layout=”normal” margintop=”0″ marginbottom=”15″ paddingtop=”0″ paddingbottom=”0″ bg_color=”#ffffff” bg_repeat=”repeat” bg_stretch=”no” en_border=”no” border_color=”#e8e8e8″][vc_column width=”1/1″][vc_separator style=”double” padding_top=”30″ padding_bottom=”20″][/vc_column][/vc_row][vc_row layout=”normal” margintop=”0″ marginbottom=”15″ paddingtop=”0″ paddingbottom=”0″ bg_color=”#ffffff” bg_repeat=”repeat” bg_stretch=”no” en_border=”no” border_color=”#e8e8e8″][vc_column width=”1/1″][vc_column_text]1. First Ottoman Map of the United States
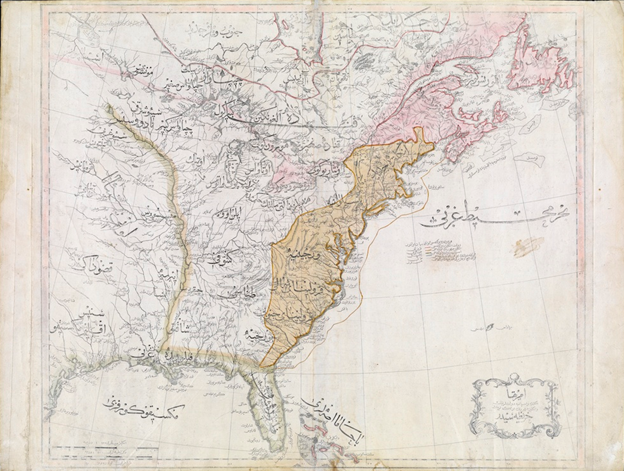
In 1803 how United States was looked like to Ottoman, it was labeled as “The Country of the English People”.
 [/vc_column_text][vc_separator style=”double” padding_top=”30″ padding_bottom=”20″][/vc_column][/vc_row][vc_row layout=”normal” margintop=”0″ marginbottom=”15″ paddingtop=”0″ paddingbottom=”0″ bg_color=”#ffffff” bg_repeat=”repeat” bg_stretch=”no” en_border=”no” border_color=”#e8e8e8″][vc_column width=”1/1″][vc_column_text]2. NYC Population Density Map at Day and Night
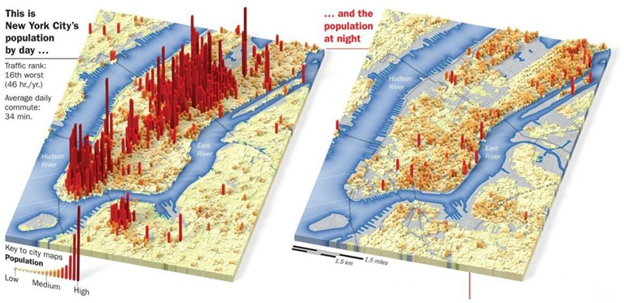
Population of New York City is 8.406 million(2013). This map shows people during day vs at night.
 [/vc_column_text][vc_separator style=”double” padding_top=”30″ padding_bottom=”20″][/vc_column][/vc_row][vc_row layout=”normal” margintop=”0″ marginbottom=”15″ paddingtop=”0″ paddingbottom=”0″ bg_color=”#ffffff” bg_repeat=”repeat” bg_stretch=”no” en_border=”no” border_color=”#e8e8e8″][vc_column width=”1/1″][vc_column_text]3. Visualizing Cities Density (New York)
 [/vc_column_text][vc_separator style=”double” padding_top=”30″ padding_bottom=”20″][/vc_column][/vc_row][vc_row layout=”normal” margintop=”0″ marginbottom=”15″ paddingtop=”0″ paddingbottom=”0″ bg_color=”#ffffff” bg_repeat=”repeat” bg_stretch=”no” en_border=”no” border_color=”#e8e8e8″][vc_column width=”1/1″][vc_column_text]4. Time-lapse (1776-1887) of the USA, seizure of indigenous land.
From Year 1776 to year 1887, American seized 12.5 billion of acres of land from America’s indigenous people.
[/vc_column_text][vc_separator style=”double” padding_top=”30″ padding_bottom=”20″][/vc_column][/vc_row][vc_row layout=”normal” margintop=”0″ marginbottom=”15″ paddingtop=”0″ paddingbottom=”0″ bg_color=”#ffffff” bg_repeat=”repeat” bg_stretch=”no” en_border=”no” border_color=”#e8e8e8″][vc_column width=”1/1″][vc_column_text]5. The USA Map that shows 7000 water channels that feed into Mississippi River
Mississippi river which has the largest drainage channels in the North America.
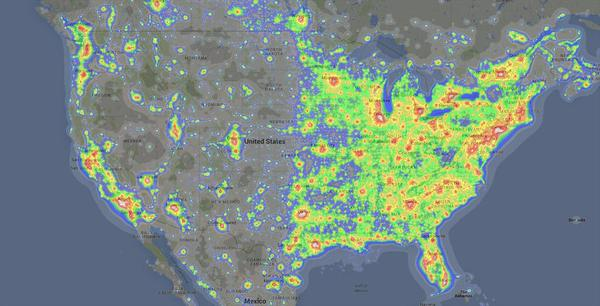
 [/vc_column_text][vc_separator style=”double” padding_top=”30″ padding_bottom=”20″][/vc_column][/vc_row][vc_row layout=”normal” margintop=”0″ marginbottom=”15″ paddingtop=”0″ paddingbottom=”0″ bg_color=”#ffffff” bg_repeat=”repeat” bg_stretch=”no” en_border=”no” border_color=”#e8e8e8″][vc_column width=”1/1″][vc_column_text]6. Light Pollution in the United States of America
 [/vc_column_text][vc_separator style=”double” padding_top=”30″ padding_bottom=”20″][/vc_column][/vc_row][vc_row layout=”normal” margintop=”0″ marginbottom=”15″ paddingtop=”0″ paddingbottom=”0″ bg_color=”#ffffff” bg_repeat=”repeat” bg_stretch=”no” en_border=”no” border_color=”#e8e8e8″][vc_column width=”1/1″][vc_column_text]7. Irish ancestry as a share of County population in the USA: St Patrick’s Day map
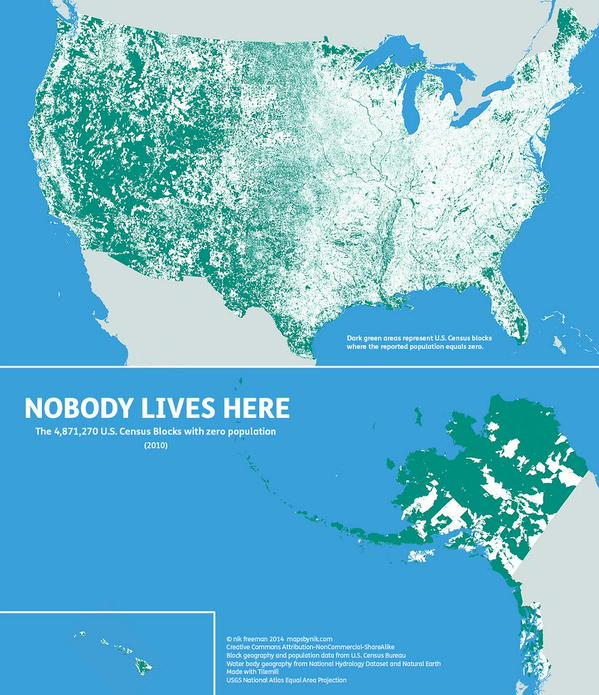
 [/vc_column_text][vc_separator style=”double” padding_top=”30″ padding_bottom=”20″][/vc_column][/vc_row][vc_row layout=”normal” margintop=”0″ marginbottom=”15″ paddingtop=”0″ paddingbottom=”0″ bg_color=”#ffffff” bg_repeat=”repeat” bg_stretch=”no” en_border=”no” border_color=”#e8e8e8″][vc_column width=”1/1″][vc_column_text]8. US Census Blocks with zero Population
Census Block is the smallest unit used by the United States Census Bureau for the tabulation of 100% of the data. Total number of the blocks in the USA is 11,155,486 (2010). According to the USA Census (2010), total blocks with zero population was 4,871,270.
 [/vc_column_text][vc_separator style=”double” padding_top=”30″ padding_bottom=”20″][/vc_column][/vc_row][vc_row layout=”normal” margintop=”0″ marginbottom=”15″ paddingtop=”0″ paddingbottom=”0″ bg_color=”#ffffff” bg_repeat=”repeat” bg_stretch=”no” en_border=”no” border_color=”#e8e8e8″][vc_column width=”1/1″][vc_column_text]9. Starbucks vs Dunkin’ Donuts
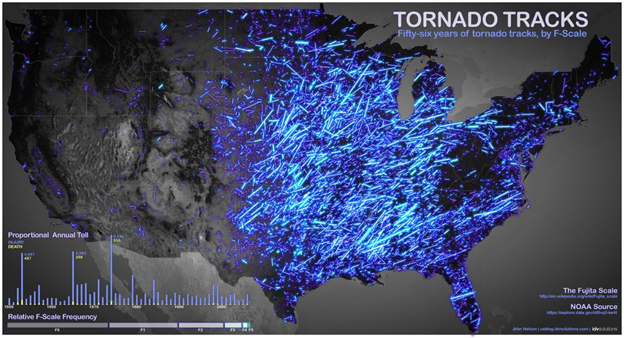
[/vc_column_text][vc_separator style=”double” padding_top=”30″ padding_bottom=”20″][/vc_column][/vc_row][vc_row layout=”normal” margintop=”0″ marginbottom=”15″ paddingtop=”0″ paddingbottom=”0″ bg_color=”#ffffff” bg_repeat=”repeat” bg_stretch=”no” en_border=”no” border_color=”#e8e8e8″][vc_column width=”1/1″][vc_column_text]10. 56 years of Tornado Tracks
Map was created from the NOAA data showing 56 years of Tornado Tracks. Data can be downloaded from the http://catalog.data.gov/dataset/tornado-tracks-and-icons-1950-2006
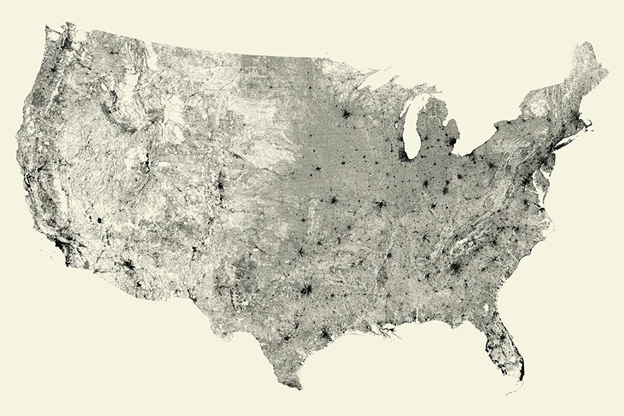
 [/vc_column_text][vc_separator style=”double” padding_top=”30″ padding_bottom=”20″][/vc_column][/vc_row][vc_row layout=”normal” margintop=”0″ marginbottom=”15″ paddingtop=”0″ paddingbottom=”0″ bg_color=”#ffffff” bg_repeat=”repeat” bg_stretch=”no” en_border=”no” border_color=”#e8e8e8″][vc_column width=”1/1″][vc_column_text]11. All the streets in the United States
 [/vc_column_text][vc_separator style=”double” padding_top=”30″ padding_bottom=”20″][/vc_column][/vc_row][vc_row layout=”normal” margintop=”0″ marginbottom=”15″ paddingtop=”0″ paddingbottom=”0″ bg_color=”#ffffff” bg_repeat=”repeat” bg_stretch=”no” en_border=”no” border_color=”#e8e8e8″][vc_column width=”1/1″][vc_column_text]12. All the streets in the United States
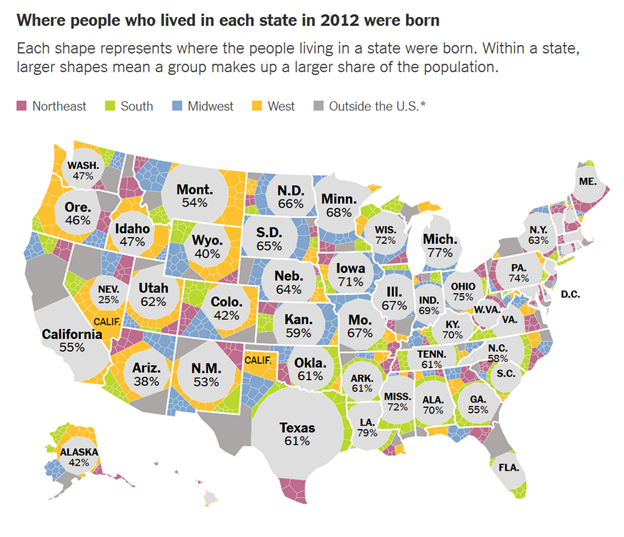
 [/vc_column_text][vc_separator style=”double” padding_top=”30″ padding_bottom=”20″][/vc_column][/vc_row][vc_row layout=”normal” margintop=”0″ marginbottom=”15″ paddingtop=”0″ paddingbottom=”0″ bg_color=”#ffffff” bg_repeat=”repeat” bg_stretch=”no” en_border=”no” border_color=”#e8e8e8″][vc_column width=”1/1″][vc_column_text]13. Population Percentage in each state that were born there
 [/vc_column_text][vc_separator style=”double” padding_top=”30″ padding_bottom=”20″][/vc_column][/vc_row][vc_row layout=”normal” margintop=”0″ marginbottom=”15″ paddingtop=”0″ paddingbottom=”0″ bg_color=”#ffffff” bg_repeat=”repeat” bg_stretch=”no” en_border=”no” border_color=”#e8e8e8″][vc_column width=”1/1″][vc_column_text]14. Growth of Walmart
[/vc_column_text][vc_separator style=”double” padding_top=”30″ padding_bottom=”20″][/vc_column][/vc_row][vc_row layout=”normal” margintop=”0″ marginbottom=”15″ paddingtop=”0″ paddingbottom=”0″ bg_color=”#ffffff” bg_repeat=”repeat” bg_stretch=”no” en_border=”no” border_color=”#e8e8e8″][vc_column width=”1/1″][vc_column_text]15. Most Popular Girls Names by State (Years)
[/vc_column_text][vc_separator style=”double” padding_top=”30″ padding_bottom=”20″][/vc_column][/vc_row][vc_row layout=”normal” margintop=”0″ marginbottom=”15″ paddingtop=”0″ paddingbottom=”0″ bg_color=”#ffffff” bg_repeat=”repeat” bg_stretch=”no” en_border=”no” border_color=”#e8e8e8″][vc_column width=”1/1″][vc_column_text]16. Most Popular Boys Names by State (Years)
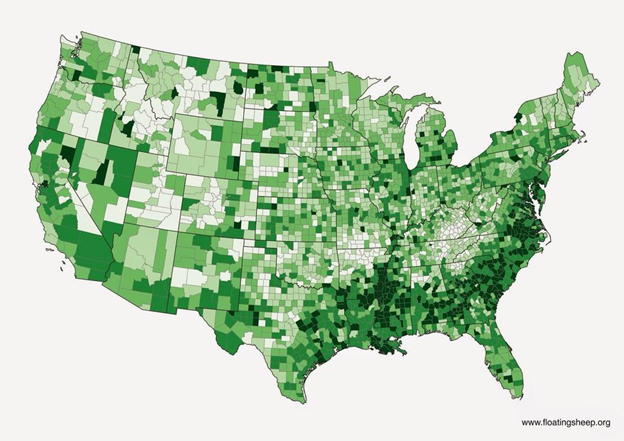
[/vc_column_text][vc_separator style=”double” padding_top=”30″ padding_bottom=”20″][/vc_column][/vc_row][vc_row layout=”normal” margintop=”0″ marginbottom=”15″ paddingtop=”0″ paddingbottom=”0″ bg_color=”#ffffff” bg_repeat=”repeat” bg_stretch=”no” en_border=”no” border_color=”#e8e8e8″][vc_column width=”1/1″][vc_column_text]17. Frequency of the word used “shit” in Geotagged Tweets
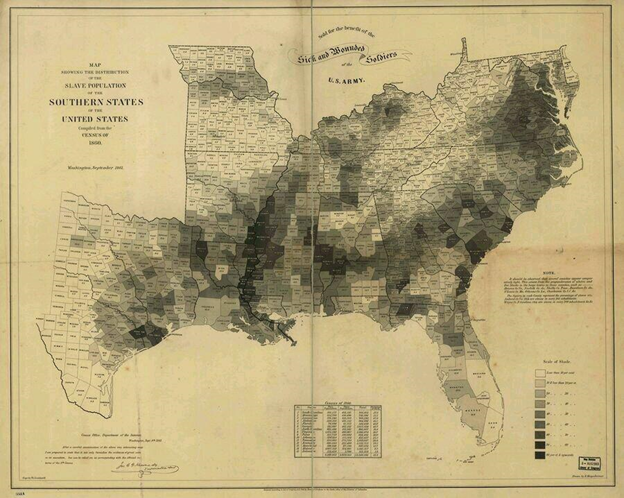
 [/vc_column_text][vc_separator style=”double” padding_top=”30″ padding_bottom=”20″][/vc_column][/vc_row][vc_row layout=”normal” margintop=”0″ marginbottom=”15″ paddingtop=”0″ paddingbottom=”0″ bg_color=”#ffffff” bg_repeat=”repeat” bg_stretch=”no” en_border=”no” border_color=”#e8e8e8″][vc_column width=”1/1″][vc_column_text]18. Abraham Lincoln’s Map, used to see the reach of Slavery, 1840 (% slaves per County)
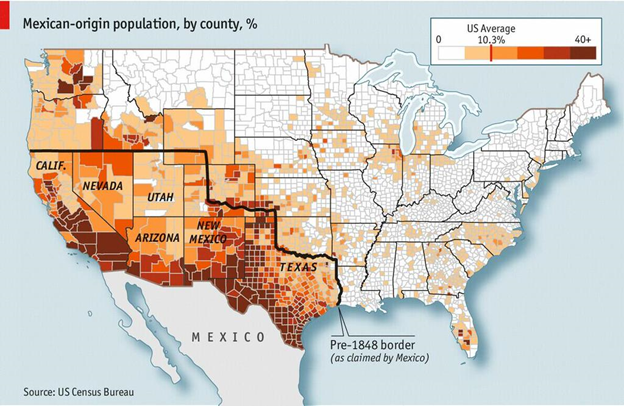
 [/vc_column_text][vc_separator style=”double” padding_top=”30″ padding_bottom=”20″][/vc_column][/vc_row][vc_row layout=”normal” margintop=”0″ marginbottom=”15″ paddingtop=”0″ paddingbottom=”0″ bg_color=”#ffffff” bg_repeat=”repeat” bg_stretch=”no” en_border=”no” border_color=”#e8e8e8″][vc_column width=”1/1″][vc_column_text]19. Mexican-Origin Population in the United States by Percentage
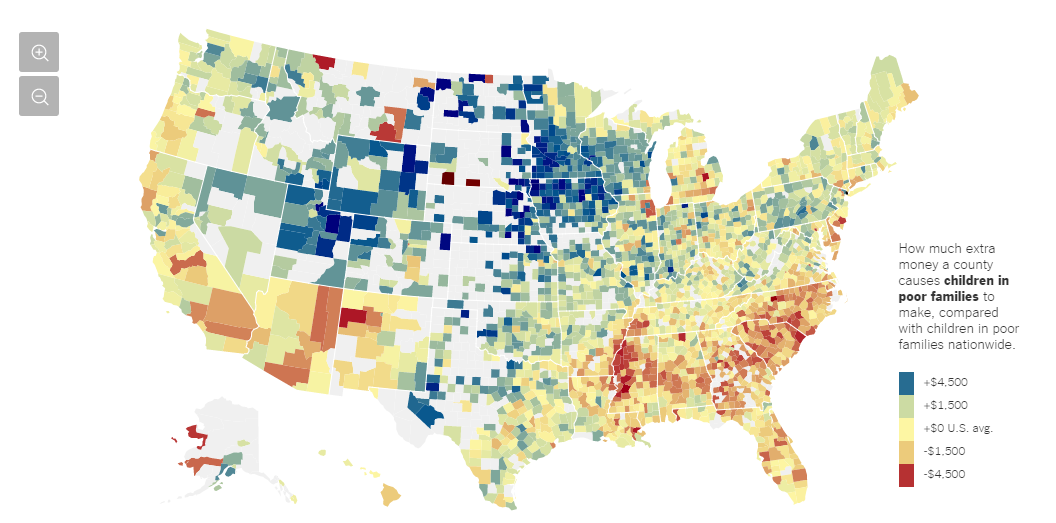
 [/vc_column_text][vc_separator style=”double” padding_top=”30″ padding_bottom=”20″][/vc_column][/vc_row][vc_row layout=”normal” margintop=”0″ marginbottom=”15″ paddingtop=”0″ paddingbottom=”0″ bg_color=”#ffffff” bg_repeat=”repeat” bg_stretch=”no” en_border=”no” border_color=”#e8e8e8″][vc_column width=”1/1″][vc_column_text]20. The Best and Worst Places to Grow Up
To browse the map well and read detail about the article, go to the page
 [/vc_column_text][vc_separator style=”double” padding_top=”30″ padding_bottom=”20″][/vc_column][/vc_row]


