Heat Map is quite popular in the GIS world which can be produced in various GIS software, I have written a tutorial on How to Create Heat Map using QGIS Software. This tutorial will show creating a heat map using Microsoft Excel version from 2013 to 2017. On this excel version, you can download the app and use them for a specific reason. For creating a heat map we will be using Geographic Heat Map App and it is free.
1. Open your Excel sheet then go to Insert > My Apps.
2. Then click on the Store and type text Geographic Heat Map on the search box. Then click on the Add button.
3. After adding the app, the first time it will automatically open the Geographical Heat Map window.
I am using the following data.
Also Read: Create Maps on Microsoft Excel 2013 using Power Map
4. Then click on the Get Started button, next window will pop out. Select the data by using the Select Data button. Under Choose map select World, Regions will take Name field and Values field will have Value. Also, assign the Color theme and Map Title. Finally hit Save button to create a map.
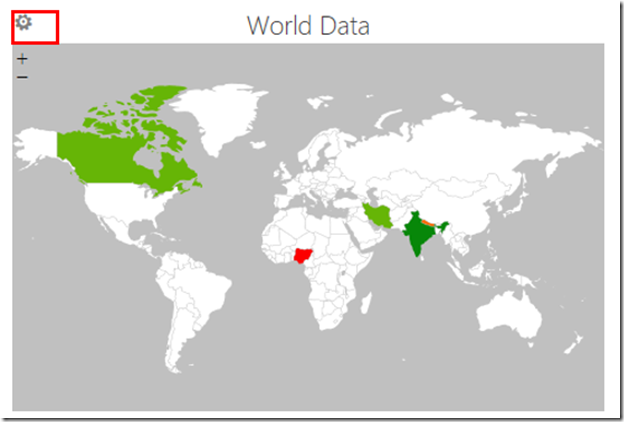
5. Final Output map by the Geographic Heat Map App.
6. IF you want to edit the values, click on the setting button.


