Almost 70 percentage of the earth surface is covered by the vegetation and it is the first to encounter the energy (sun). Vegetation is important for the earth ecosystem, understanding their behavior is essential. Remote sensing open the door to understand vegetation phenomenon that cannot be seen through eye or analyzed by any simple tools. It is necessary to understand the type of vegetation, it’s distribution, it’s growth pattern change or change in the physiology and morphology. This type of change helps scientists to understand change in climate, soil, geology or physical change in the area. Vegetation here might be means: agriculture, forests, rangeland, wetland and manicured urban vegetation.

Figure 1: Process for Remote Sensing, go to 1. Introduction, what is remote sensing for process: A, B, C, D, E
Photosynthesis Process: Photosynthesis that runs on the leaf is the energy storing process which operates under the presence of the light energy. Light energy is stored in the form of sugar molecule (glucose) which is produced from carbon dioxide (CO2) present in air and water (H2o) absorbed from soil through plant roots. During the process of making sugar (C6H12O6), oxygen is released as a by-product into the atmosphere. Photosynthesis process start as sunlight hit the chloroplasts, green substance called chlorophyll. Plant maintains their own internal and external structure to perform photosynthesis. This structure interaction with the electromagnetic energy has direct impact on how leafs spectral signature appears when recorded using remote sensing technology.
Spectral Characteristics of Vegetation: A green leaf intercepts incident radiant flux (????i) directly from the sun. This electromagnetic energy interacts within the leave pigment, water and inter-cellular air space. Total amount of the radian flux (????p) reflected from leaf, amount of the radian flux (????α) absorbed by leaf and total amount of radian flux (????????) transmitted through the leaf is measured by the following formula. So the equation is for the total spectral (????) radian flux for the leaf is:
????i???? = ????p???? + ????α???? + ????????????
Dividing each of the variable by the original incident radiant flux, ????i????
????i???? / ????i???? = ????p????/ ????i???? + ????α????/ ????i???? + ????????????/ ????i????
Will be
i???? = p???? + α???? + ????????
Where
p???? = spectral hemispherical reflectance
α????= spectral hemispherical absorptance
????????= spectral hemispherical transmittance
Above equation can be think as of
p???? = i???? – (α???? + ????????)
Which means energy reflected from the leaf is equal to incident energy minus energy absorbed by the leaf for the photosynthesis process and other amount of energy transmitted directly through the leaf for other purposed or to the ground surface.
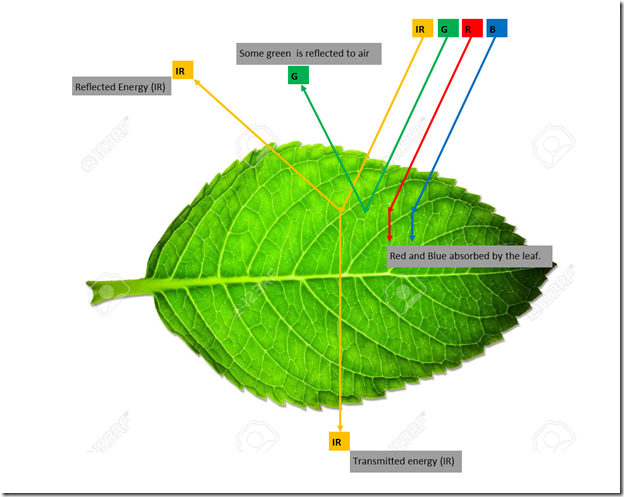
Spectral Signature of the Living Leaf: Chlorophyll nature toward electromagnetic wave is different, it does not absorb green light rather blue and red for the photosynthesis process. It absorb 60 to 85 percentage of incident light. Out of that total light only little green light is absorb that is why human eye who has the capability to see light in the visible range observe dominant green color on the healthy vegetation.
Leaf behave differently on the near infrared spectrum, this not due to the green pigments rather than by the spongy mesophyll tissue. The internal structures are almost transparent to the infrared radiation. That is why very little infrared radiation is reflected by the outer portion of the leaf. Mesophyll tissues and cavities within the leaf scatter the radiation passed through the upper epidermis. This infrared energy is absorbed very less by internal cell, almost around 60% is scattered upward which is called reflected energy or downward which is called transmitted energy, see Figure 2. Mainly internal structure (Cell) is responsible for the infrared reflectance by the green vegetation.
Figure 2: Interaction of lights and leaf internal structure within the Visible and Infrared Radiation.
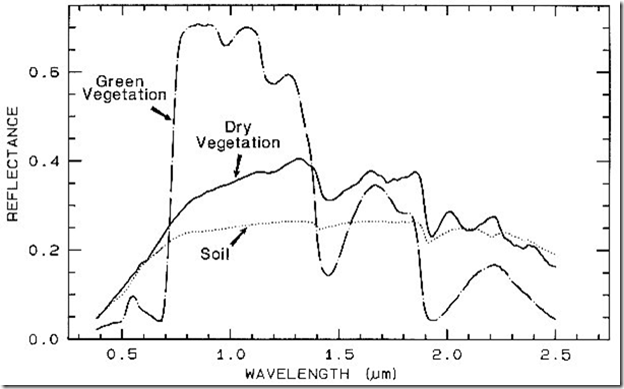
Red lights absorption start to decline at the edge of the visible range and infrared wave reflectance increases sharply. If reflectance of energy is to measure in both visible and infrared region then curve will be very high in infrared region compared to visible range in a healthy vegetation leaf. This infrared behavior helps researchers to study the vegetation; also help to differentiate between vegetation and non-vegetation. Infrared reflectance also helps to differentiate vegetation classes and different reflectance value for different vegetation. If plants matured or under stress they behave differently in infrared or in visible range. But this type characteristic is more recognizable in the infrared region. Figure 9
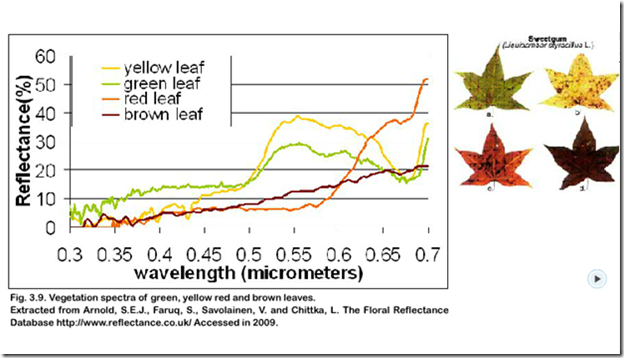
Here are few spectral signature graph of the leaf which might be helpful to understand vegetation reaction with the electromagnetic wave. I have browse the internet for the spectral signature for different condition.
Figure 3: Reflectance of Vegetation at different wavelength and comparison with Soil and Water. image source: seos-project.eu
Figure 4: Vegetation Spectral Reflectance Curves, image source: gsp.humboldt.edu
Figure 5: Spectral Signature of different type of vegetation: image source: researchgate.net
Figure 6: Spectral Signature of green vegetation compared to dry: image source: academic.emporia.edu
Figure 7: Spectral Signature of different vegetation landscape: image source: ces.iisc.ernet.in
Figure 8: Spectral Signature of different phases of leaf, image source: eumetrain.org
Figure 9: Vegetation Spectral Signature of healthy vs stressed, image source: researchgate.net
Figure 10: Red edge shift, due to chlorophyll concentration change. High chlorophyll increases absorption in the red region and pushes the red edge to longer wavelengths. image source: seos-project.eu
Figure 10: Spectral signatures for all crops organized by number of days after planting,
Research Paper: http://www.mdpi.com/2072-4292/6/2/925/htm
Figure 11: Spectral profiles for all vegetation communities. Inset photographs show the dominant vegetation community type. The blank lines show the mean value of the spectral signatures (individual spectral samples are shown in grey). The sample locations at Barrow include: (a) Dry lichen heath; (b) Mesic sedge-grass-herb meadow; and (c) wet sedge tundra. The sample locations at Atqasuk include: (d) tussock tundra (sandy substrates); and (e) wet sedge meadow. Samples at Ivotuk include: (f) tussock tundra (non-sandy substrates); (g) mixed shrub-sedge tussock; and (h) wet sedge meadow.
Research Paper: http://www.mdpi.com/2072-4292/8/12/978/html
References:
Introduction of Remote Sensing by James B. Campbell and Randolph H. Wynne, 5th Edition
Remote Sensing of the Environment by John R. Jensen, 2nd Edition


