Global fortune 500 is the list of 500 companies in the world which are measured based on their revenue. This list is compiled and measured by the Fortune magazine every year. Global Fortune 500 was born in year 1995, before year 1995 fortune magazine only published 500 list of USA companies. Cutoff date for measuring revenue is on or before march 31st . Every year list changes its geographical location, please see below maps. To qualify for the 500 list all the companies should publish their revenue to their government agencies. Company get’s disqualified if they did not publish their revenue.
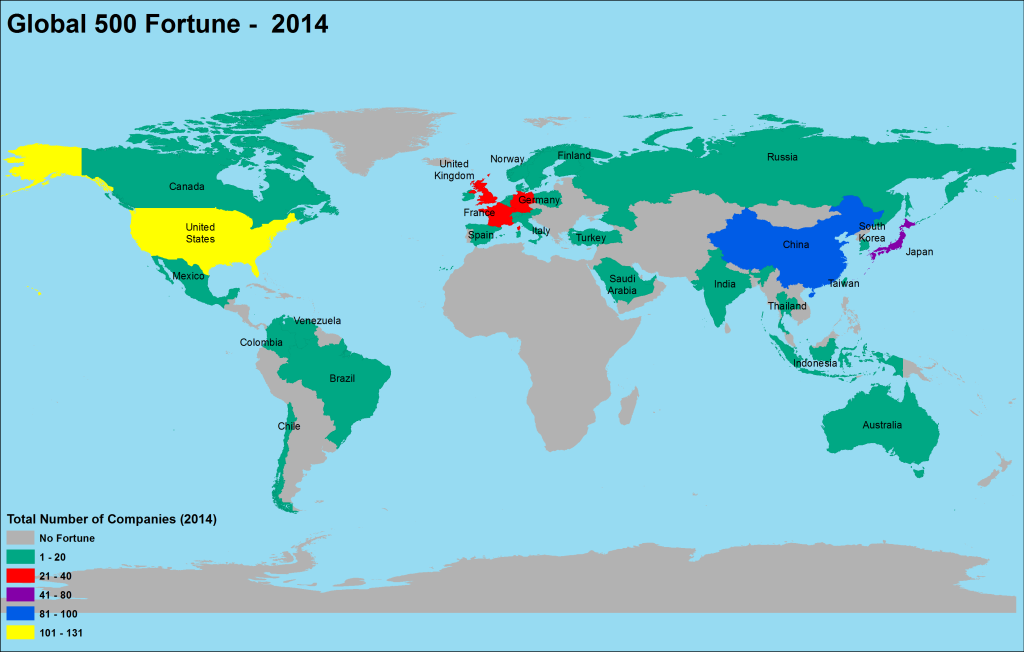
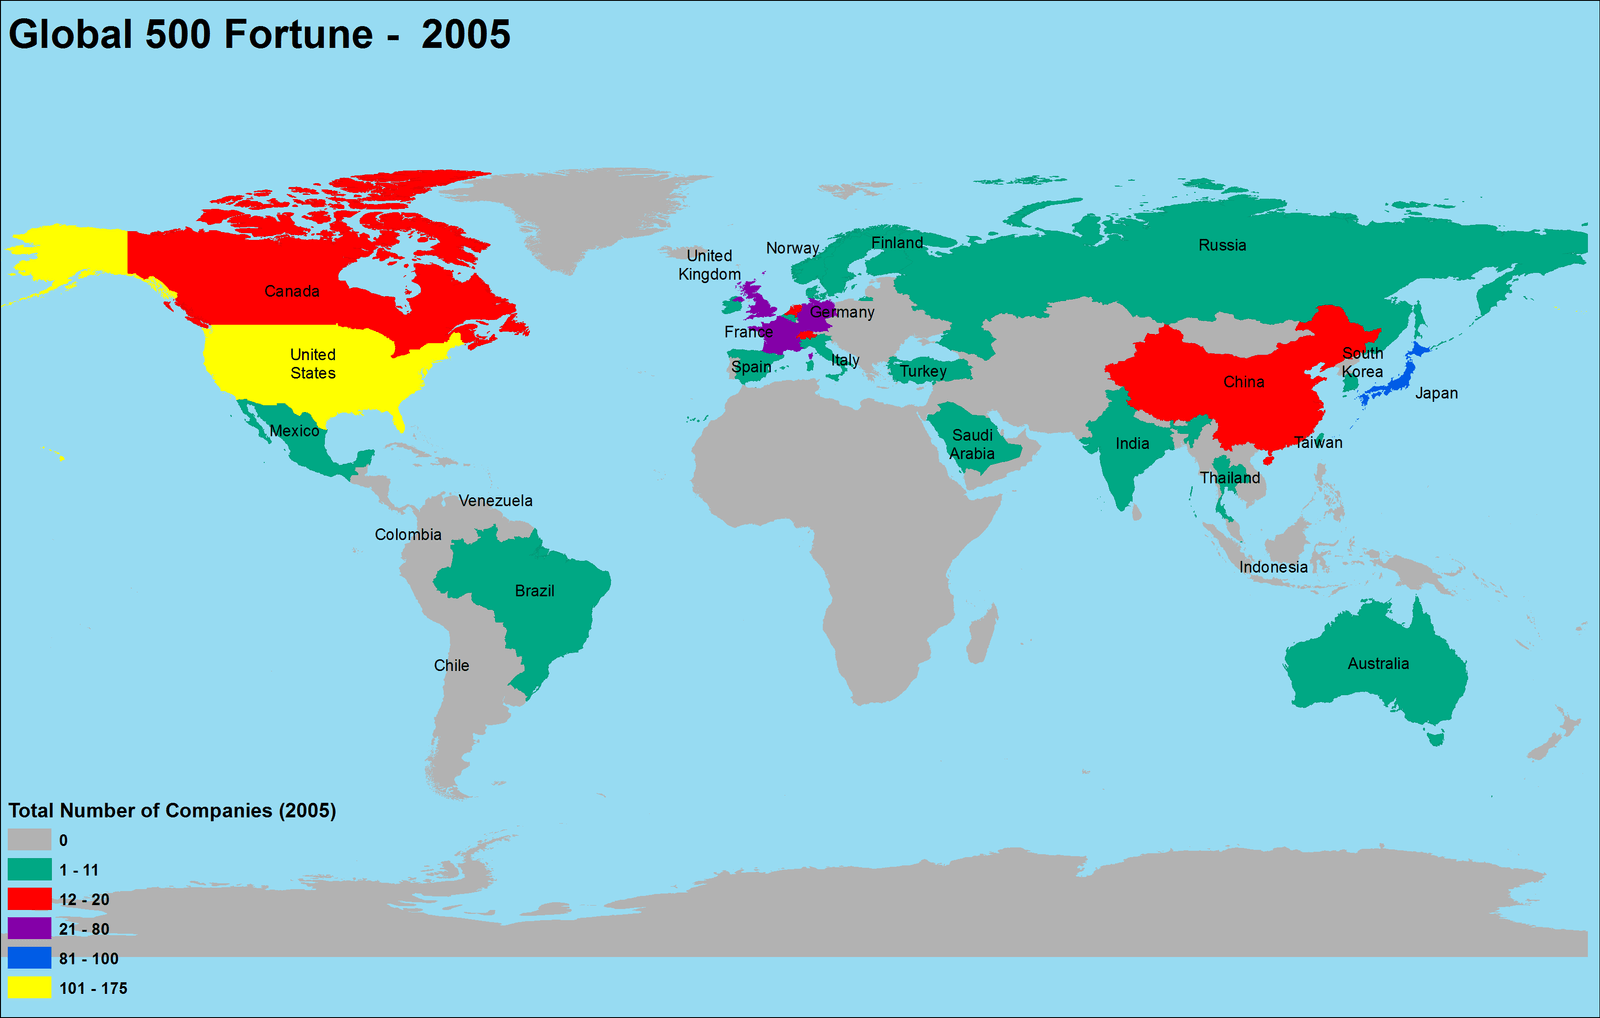
We have included data from year 2005 to 2014 and lots of changes has happened . On 2005 North America total number of companies were 189 and in 2014 changed to 141. In same way, Asian company were 123 on year 2005 and 197 in 2014. Other interesting figure that we notice is on 2005, total USA companies were 175 which got decreased to 131 in year 2014. But China saw huge growth from 18 company in year 2005 to 95 in year 2014. So much change has happened within a decade and this listing keep on changing it,s location. It will be interesting to see global fortune 500 list for year 2015.
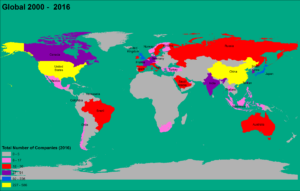
Forbes magazine also publish list of Global 2000 companies every year.
Quick Comparison Between Six Countries:
China changed it’s fortune from 47 in year 2010 to 95 in year 2014. United kingdom did not see major changes while USA lost 10 companies within 5 years. In same way Japan lost 14 companies within 5 years and France ,Germany both lost their fortune.


I would like to give credits to following websites from where I collected data but not responsible for any errors or omissions . http://en.wikipedia.org/wiki/Fortune_Global_500, http://fortune.com/global500/, http://topforeignstocks.com/downloads/, http://www.economywatch.com/fortune-500-companies
http://geocommons.com/ (gis data)
|
2005
|
|
|
Charts
|
|
|

|
|
|
|
Maps
|
|
|

|
|
|
Data
|
|
|
Continent
|
Country
|
Total Number
|
Percentage of Total
|
|
Asia
|
China
|
18
|
3.6%
|
|
India
|
5
|
1.0%
|
|
Japan
|
81
|
16.2%
|
|
Russia
|
3
|
0.6%
|
|
Saudi Arabia
|
1
|
0.2%
|
|
Singapore
|
1
|
0.2%
|
|
South Korea
|
11
|
2.2%
|
|
Taiwan
|
1
|
0.2%
|
|
Thailand
|
1
|
0.2%
|
|
Turkey
|
1
|
0.2%
|
|
Sub – Total
|
|
123
|
24.6%
|
|
Europe
|
Belgium
|
4
|
0.8%
|
|
Denmark
|
2
|
0.4%
|
|
Finland
|
3
|
0.6%
|
|
France
|
40
|
8.0%
|
|
Germany
|
34
|
6.8%
|
|
Ireland
|
2
|
0.4%
|
|
Italy
|
10
|
2.0%
|
|
Netherlands
|
13
|
2.6%
|
|
Norway
|
2
|
0.4%
|
|
Spain
|
7
|
1.4%
|
|
Sweden
|
7
|
1.4%
|
|
Switzerland
|
14
|
2.8%
|
|
United Kingdom
|
33
|
6.6%
|
|
Sub – Total
|
|
171
|
34.2%
|
|
North America
|
Canada
|
14
|
2.8%
|
|
United States
|
175
|
35.0%
|
|
Sub – Total
|
|
189
|
37.8%
|
|
Oceania
|
Australia
|
11
|
2.2%
|
|
Sub – Total
|
|
11
|
2.2%
|
|
South America
|
Brazil
|
4
|
0.8%
|
|
Mexico
|
2
|
0.4%
|
|
Sub – Total
|
|
6
|
1.2%
|
|
Total
|
|
500
|
100.0%
|
|
|
|
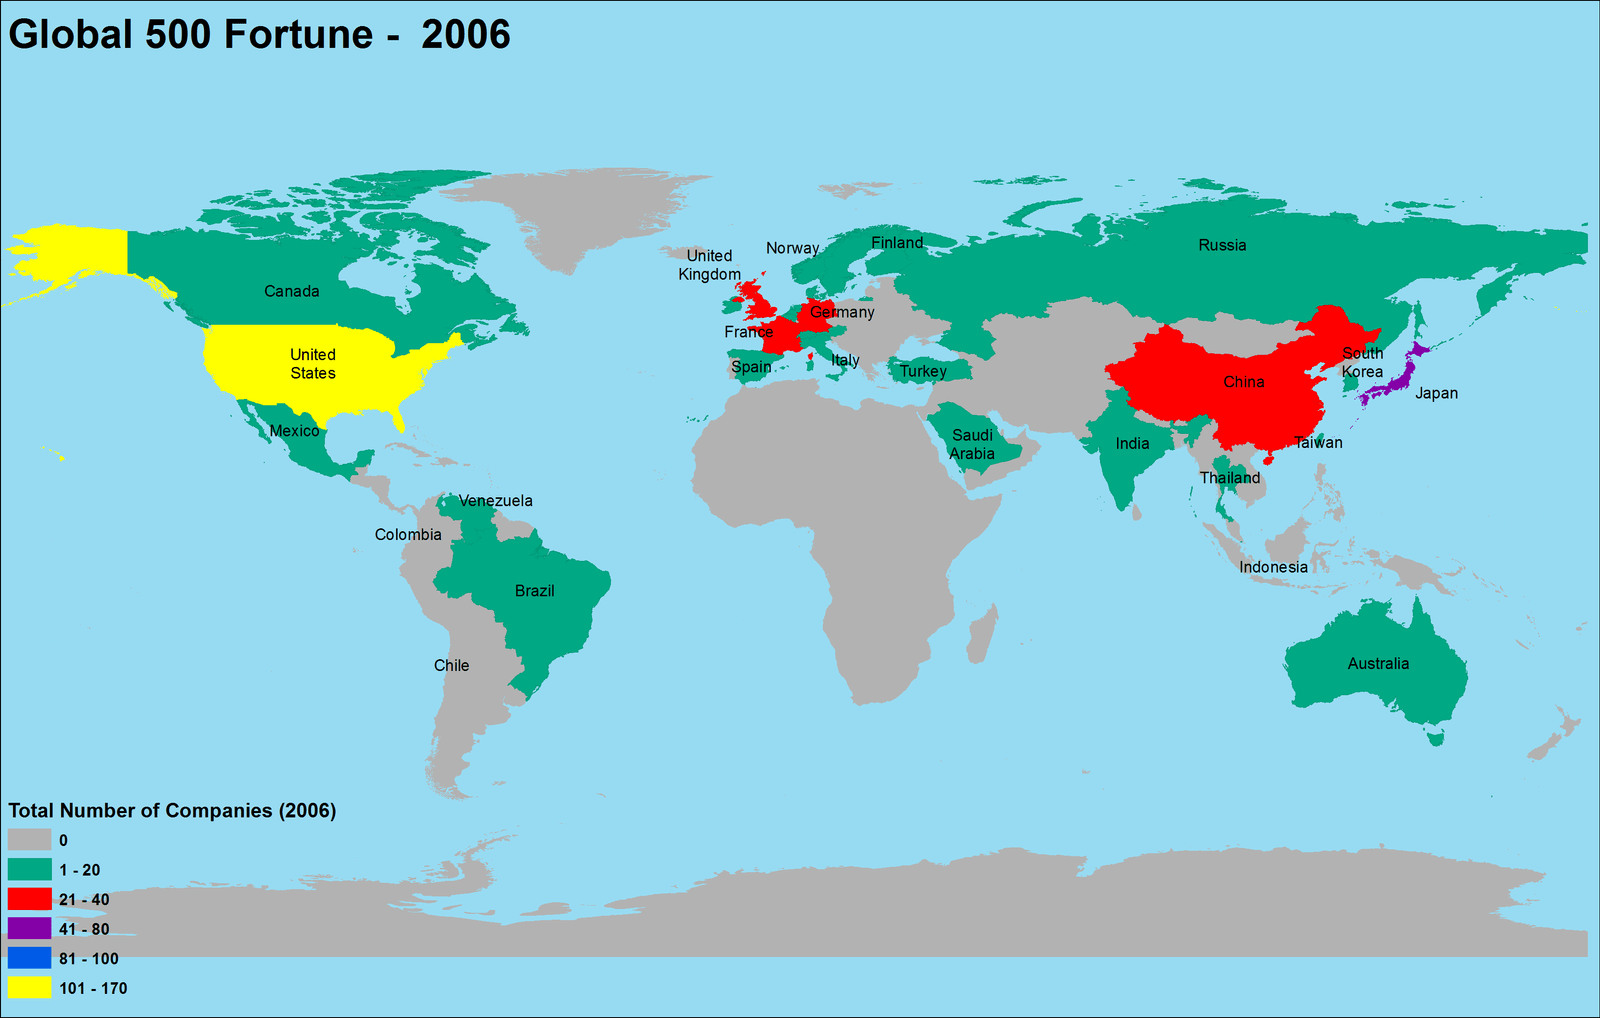
2006
|
|
|
Charts
|
|
|

|
|
|
Maps
|
|
|

|
|
|
Data
|
|
|
Continent
|
Country
|
Total Number
|
Percentage of Total
|
|
Asia
|
China
|
21
|
4.2%
|
|
India
|
6
|
1.2%
|
|
Japan
|
70
|
14.0%
|
|
Russia
|
5
|
1.0%
|
|
Saudi Arabia
|
1
|
0.2%
|
|
Singapore
|
1
|
0.2%
|
|
South Korea
|
12
|
2.4%
|
|
Taiwan
|
3
|
0.6%
|
|
Thailand
|
1
|
0.2%
|
|
Turkey
|
1
|
0.2%
|
|
Sub – Total
|
|
121
|
24.2%
|
|
Europe
|
Austria
|
1
|
0.2%
|
|
Belgium
|
5
|
1.0%
|
|
Denmark
|
2
|
0.4%
|
|
Finland
|
2
|
0.4%
|
|
France
|
39
|
7.8%
|
|
Germany
|
33
|
6.6%
|
|
Ireland
|
2
|
0.4%
|
|
Italy
|
11
|
2.2%
|
|
Netherlands
|
12
|
2.4%
|
|
Norway
|
2
|
0.4%
|
|
Spain
|
8
|
1.6%
|
|
Sweden
|
6
|
1.2%
|
|
Switzerland
|
15
|
3.0%
|
|
United Kingdom
|
36
|
7.2%
|
|
Sub – Total
|
|
174
|
34.8%
|
|
North America
|
Canada
|
15
|
3.0%
|
|
United States
|
170
|
34.0%
|
|
Sub – Total
|
|
185
|
37.0%
|
|
Oceania
|
Australia
|
10
|
2.0%
|
|
Sub – Total
|
|
10
|
2.0%
|
|
South America
|
Brazil
|
5
|
1.0%
|
|
Mexico
|
4
|
0.8%
|
|
Venezuela
|
1
|
0.2%
|
|
Sub – Total
|
|
10
|
2.0%
|
|
Total
|
|
500
|
100.0%
|
|
|
|
|
|
2007
|
|
|
Charts
|
|
|

|
|
|
Maps
|
|
|

|
|
|
Data
|
|
|
Continent
|
Country
|
Total Number
|
Percentage of Total
|
|
Asia
|
China
|
25
|
5.0%
|
|
India
|
6
|
1.2%
|
|
Japan
|
67
|
13.4%
|
|
Russia
|
4
|
0.8%
|
|
Saudi Arabia
|
1
|
0.2%
|
|
Singapore
|
1
|
0.2%
|
|
South Korea
|
14
|
2.8%
|
|
Taiwan
|
5
|
1.0%
|
|
Thailand
|
1
|
0.2%
|
|
Turkey
|
1
|
0.2%
|
|
Sub – Total
|
|
125
|
25.0%
|
|
Europe
|
Austria
|
1
|
0.2%
|
|
Belgium
|
6
|
1.2%
|
|
Denmark
|
2
|
0.4%
|
|
Finland
|
3
|
0.6%
|
|
France
|
39
|
7.8%
|
|
Germany
|
35
|
7.0%
|
|
Ireland
|
3
|
0.6%
|
|
Italy
|
10
|
2.0%
|
|
Netherlands
|
12
|
2.4%
|
|
Norway
|
2
|
0.4%
|
|
Poland
|
1
|
0.2%
|
|
Spain
|
8
|
1.6%
|
|
Sweden
|
6
|
1.2%
|
|
Switzerland
|
16
|
3.2%
|
|
United Kingdom
|
31
|
6.2%
|
|
Sub – Total
|
|
175
|
35.0%
|
|
North America
|
Canada
|
17
|
3.4%
|
|
United States
|
162
|
32.4%
|
|
Sub – Total
|
|
179
|
35.8%
|
|
Oceania
|
Australia
|
10
|
2.0%
|
|
Sub – Total
|
|
10
|
2.0%
|
|
South America
|
Brazil
|
6
|
1.2%
|
|
Mexico
|
5
|
1.0%
|
|
Sub – Total
|
|
11
|
2.2%
|
|
Total
|
|
500
|
100.0%
|
|
|
|
|
|
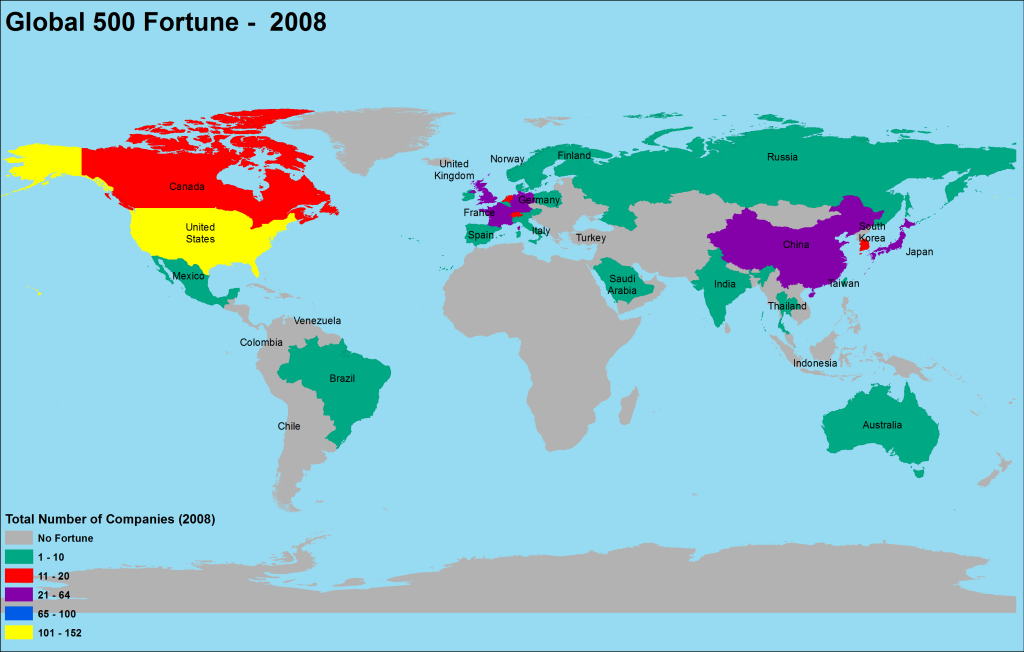
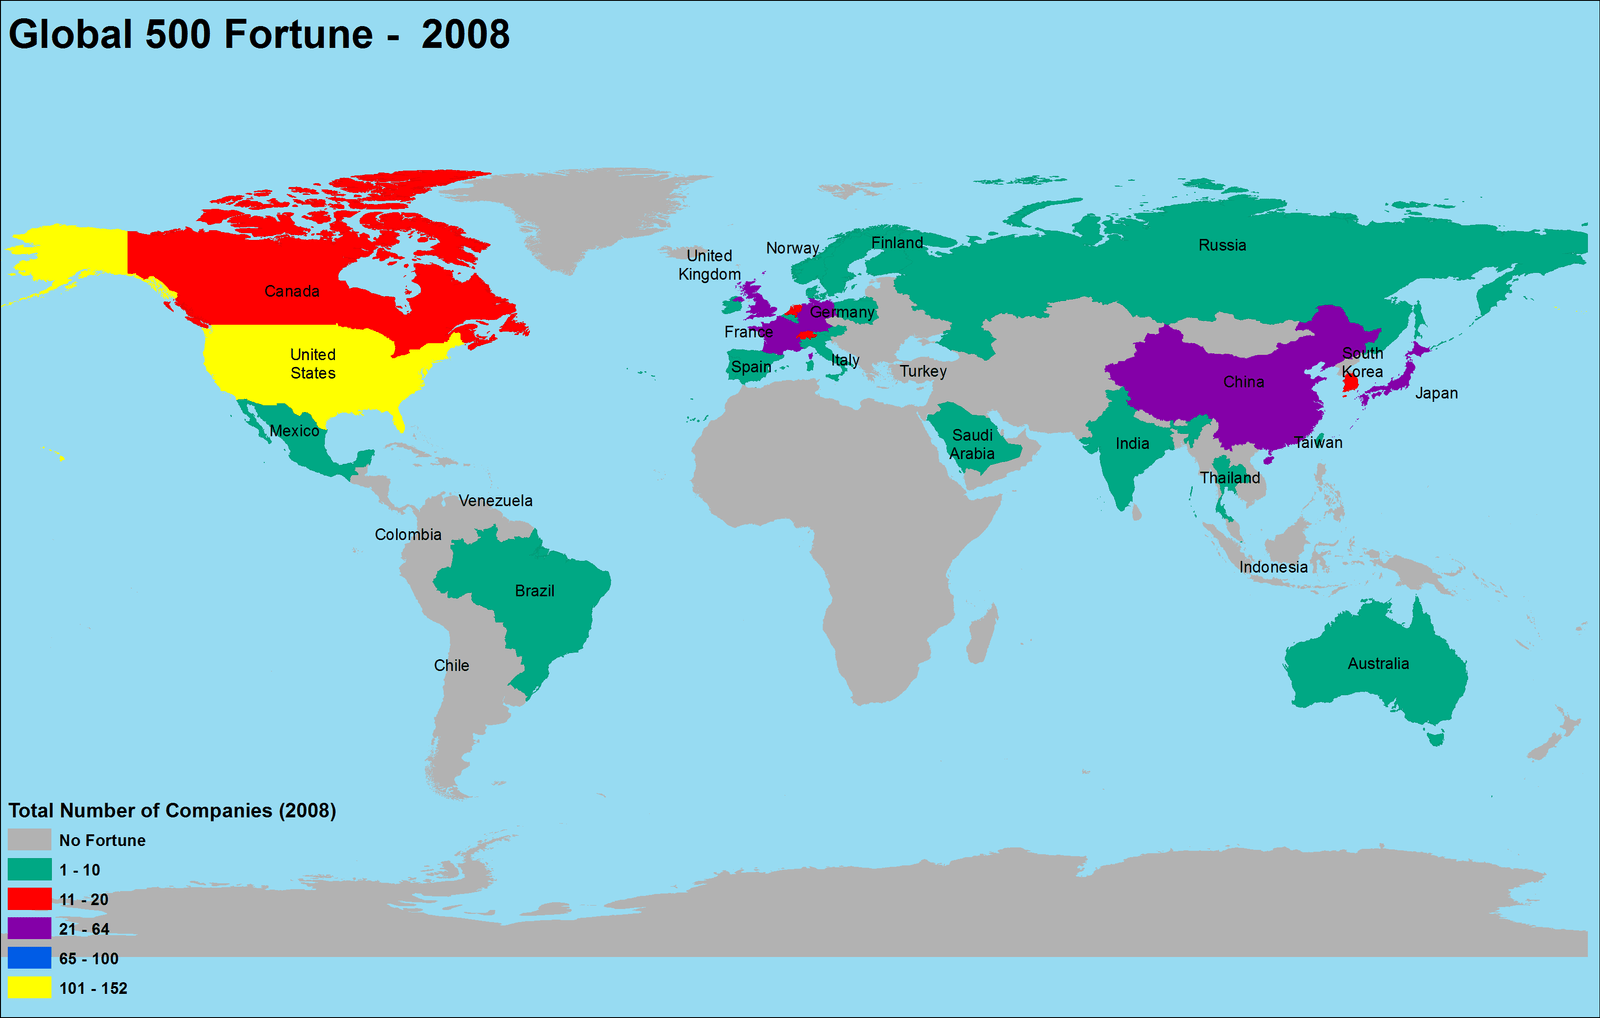
2008
|
|
|
Charts
|
|
|

|
|
|
Maps
|
|
|
|
|
|
Data
|
|
|
Continent
|
Country
|
Total Number
|
Percentage of Total
|
|
Asia
|
China
|
30
|
6.0%
|
|
India
|
7
|
1.4%
|
|
Japan
|
64
|
12.8%
|
|
Russia
|
5
|
1.0%
|
|
Saudi Arabia
|
1
|
0.2%
|
|
Singapore
|
1
|
0.2%
|
|
South Korea
|
16
|
3.2%
|
|
Taiwan
|
5
|
1.0%
|
|
Thailand
|
1
|
0.2%
|
|
Sub – Total
|
|
130
|
26.0%
|
|
Europe
|
Austria
|
2
|
0.4%
|
|
Belgium
|
6
|
1.2%
|
|
Denmark
|
2
|
0.4%
|
|
Finland
|
2
|
0.4%
|
|
France
|
40
|
8.0%
|
|
Germany
|
36
|
7.2%
|
|
Ireland
|
3
|
0.6%
|
|
Italy
|
10
|
2.0%
|
|
Luxembourg
|
1
|
0.2%
|
|
Netherlands
|
13
|
2.6%
|
|
Norway
|
2
|
0.4%
|
|
Poland
|
1
|
0.2%
|
|
Portugal
|
1
|
0.2%
|
|
Spain
|
10
|
2.0%
|
|
Sweden
|
6
|
1.2%
|
|
Switzerland
|
16
|
3.2%
|
|
United Kingdom
|
33
|
6.6%
|
|
Sub – Total
|
|
184
|
36.8%
|
|
North America
|
Canada
|
14
|
2.8%
|
|
United States
|
152
|
30.4%
|
|
Sub – Total
|
|
166
|
33.2%
|
|
Oceania
|
Australia
|
9
|
1.8%
|
|
Sub – Total
|
|
9
|
1.8%
|
|
South America
|
Brazil
|
6
|
1.2%
|
|
Mexico
|
5
|
1.0%
|
|
Sub – Total
|
|
11
|
2.2%
|
|
Total
|
|
500
|
100.0%
|
|
|
|
|
|
2009
|
|
|
Charts
|
|
|

|
|
|
Maps
|
|
|

|
|
|
Data
|
|
|
Continent
|
Country
|
Total Number
|
Percentage of Total
|
|
Asia
|
China
|
38
|
7.6%
|
|
India
|
7
|
1.4%
|
|
Israel
|
1
|
0.2%
|
|
Japan
|
68
|
13.6%
|
|
Russia
|
7
|
1.4%
|
|
Saudi Arabia
|
1
|
0.2%
|
|
Singapore
|
2
|
0.4%
|
|
South Korea
|
15
|
3.0%
|
|
Taiwan
|
5
|
1.0%
|
|
Thailand
|
1
|
0.2%
|
|
Sub – Total
|
|
145
|
29.0%
|
|
Europe
|
Austria
|
2
|
0.4%
|
|
Belgium
|
5
|
1.0%
|
|
Denmark
|
2
|
0.4%
|
|
Finland
|
2
|
0.4%
|
|
France
|
41
|
8.2%
|
|
Germany
|
38
|
7.6%
|
|
Hungary
|
1
|
0.2%
|
|
Ireland
|
2
|
0.4%
|
|
Italy
|
10
|
2.0%
|
|
Luxembourg
|
1
|
0.2%
|
|
Netherlands
|
12
|
2.4%
|
|
Norway
|
1
|
0.2%
|
|
Poland
|
1
|
0.2%
|
|
Portugal
|
2
|
0.4%
|
|
Spain
|
11
|
2.2%
|
|
Sweden
|
6
|
1.2%
|
|
Switzerland
|
16
|
3.2%
|
|
United Kingdom
|
26
|
5.2%
|
|
Sub – Total
|
|
179
|
35.8%
|
|
North America
|
Canada
|
14
|
2.8%
|
|
United States
|
140
|
28.0%
|
|
Sub – Total
|
|
154
|
30.8%
|
|
Oceania
|
Australia
|
10
|
2.0%
|
|
Sub – Total
|
|
10
|
2.0%
|
|
South America
|
Brazil
|
7
|
1.4%
|
|
Mexico
|
4
|
0.8%
|
|
Venezuela
|
1
|
0.2%
|
|
Sub – Total
|
|
12
|
2.4%
|
|
Total
|
|
500
|
100.0%
|
|
|
|
|
|
2010
|
|
|
Charts
|
|
|

|
|
|
Maps
|
|
|

|
|
|
Data
|
|
|
Continent
|
Country
|
Total Number
|
Percentage of Total
|
|
Asia
|
China
|
47
|
9.4%
|
|
India
|
8
|
1.6%
|
|
Japan
|
71
|
14.2%
|
|
Russia
|
6
|
1.2%
|
|
Saudi Arabia
|
1
|
0.2%
|
|
Singapore
|
2
|
0.4%
|
|
South Korea
|
11
|
2.2%
|
|
Taiwan
|
7
|
1.4%
|
|
Thailand
|
1
|
0.2%
|
|
Sub – Total
|
|
154
|
30.8%
|
|
Europe
|
Austria
|
3
|
0.6%
|
|
Belgium
|
5
|
1.0%
|
|
Denmark
|
2
|
0.4%
|
|
Finland
|
1
|
0.2%
|
|
France
|
40
|
8.0%
|
|
Germany
|
36
|
7.2%
|
|
Ireland
|
2
|
0.4%
|
|
Italy
|
11
|
2.2%
|
|
Luxembourg
|
1
|
0.2%
|
|
Netherlands
|
14
|
2.8%
|
|
Norway
|
1
|
0.2%
|
|
Poland
|
1
|
0.2%
|
|
Spain
|
9
|
1.8%
|
|
Sweden
|
5
|
1.0%
|
|
Switzerland
|
15
|
3.0%
|
|
United Kingdom
|
29
|
5.8%
|
|
Sub – Total
|
|
175
|
35.0%
|
|
North America
|
Canada
|
11
|
2.2%
|
|
United States
|
141
|
28.2%
|
|
Sub – Total
|
|
152
|
30.4%
|
|
Oceania
|
Australia
|
9
|
1.8%
|
|
Sub – Total
|
|
9
|
1.8%
|
|
South America
|
Brazil
|
8
|
1.6%
|
|
Mexico
|
1
|
0.2%
|
|
Venezuela
|
1
|
0.2%
|
|
Sub – Total
|
|
10
|
2.0%
|
|
Total
|
|
500
|
100.0%
|
|
|
|
|
|
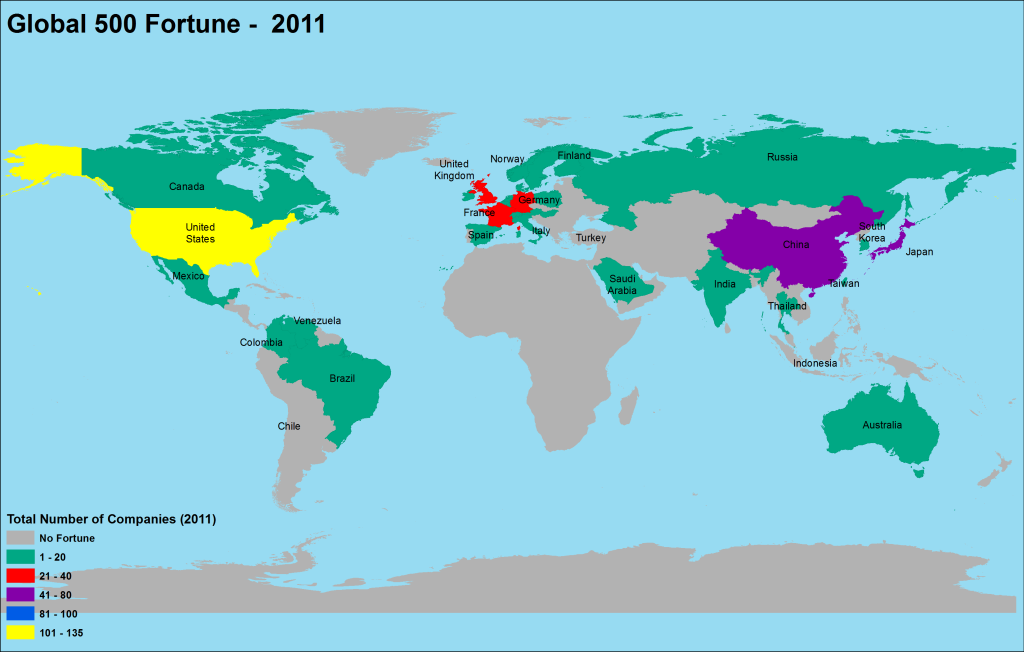
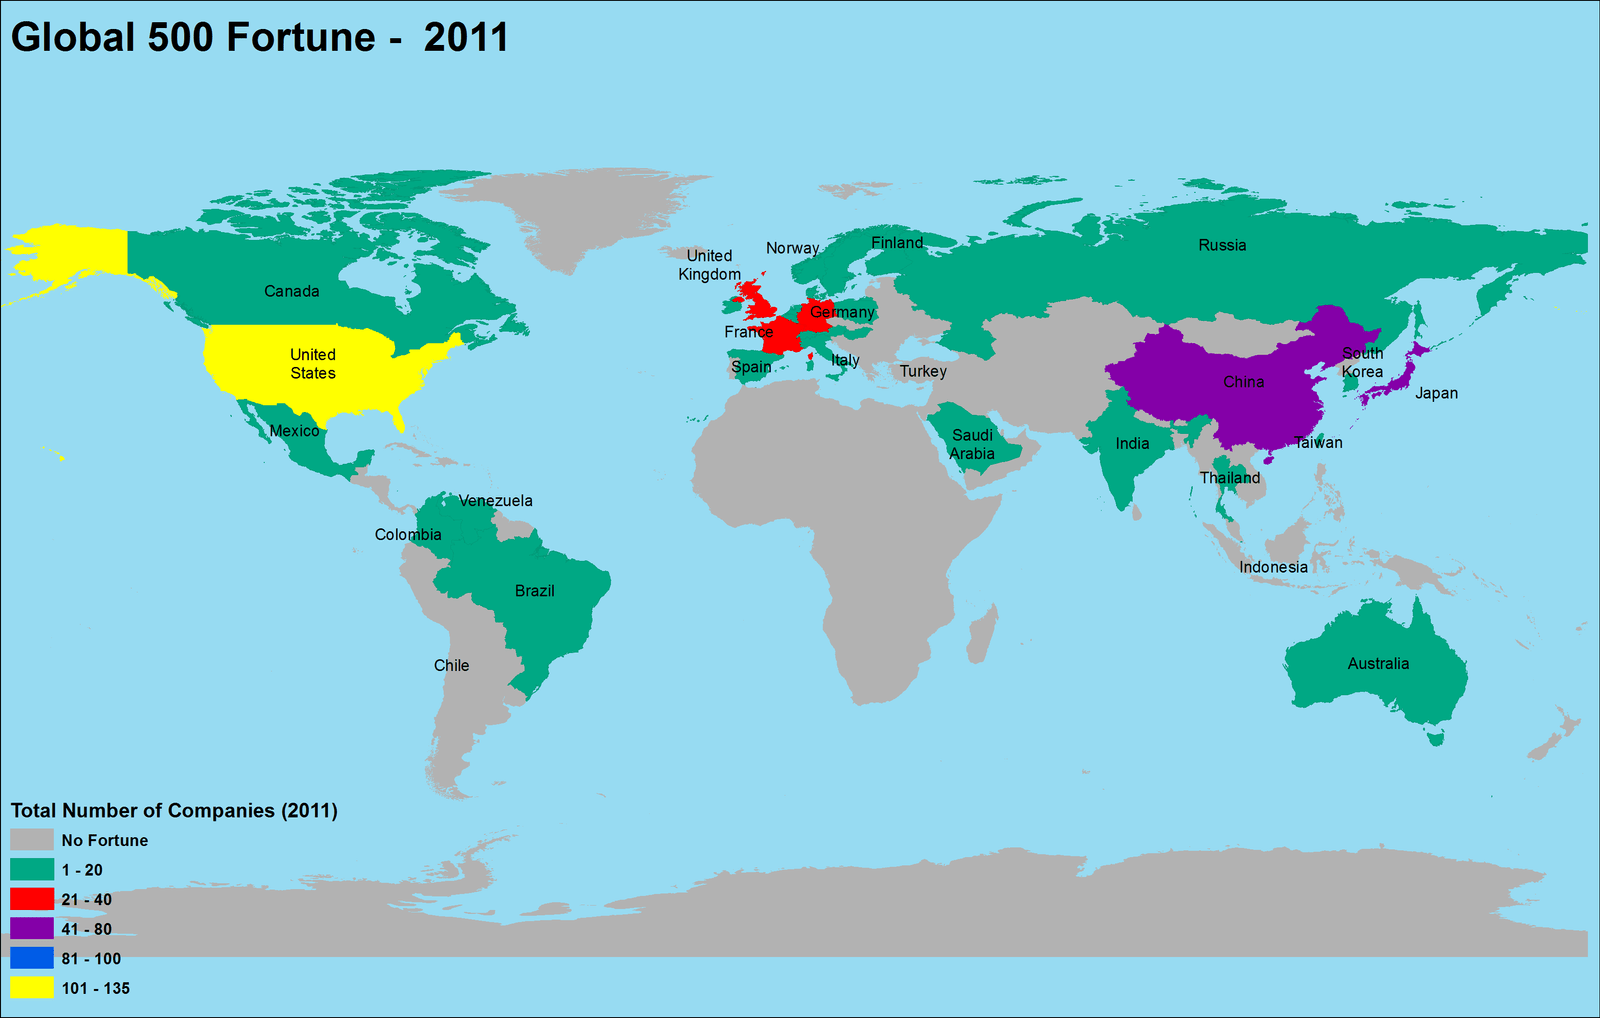
2011
|
|
|
Charts
|
|
|

|
|
|
Maps
|
|
|
|
|
|
Data
|
|
|
Continent
|
Country
|
Total Number
|
Percentage of Total
|
|
Asia
|
China
|
62
|
12.4%
|
|
India
|
8
|
1.6%
|
|
Japan
|
68
|
13.6%
|
|
Russia
|
7
|
1.4%
|
|
Saudi Arabia
|
1
|
0.2%
|
|
Singapore
|
2
|
0.4%
|
|
South Korea
|
15
|
3.0%
|
|
Taiwan
|
7
|
1.4%
|
|
Thailand
|
1
|
0.2%
|
|
Sub – Total
|
|
171
|
34.2%
|
|
Europe
|
Austria
|
1
|
0.2%
|
|
Belgium
|
5
|
1.0%
|
|
Denmark
|
2
|
0.4%
|
|
Finland
|
1
|
0.2%
|
|
France
|
36
|
7.2%
|
|
Germany
|
33
|
6.6%
|
|
Hungary
|
1
|
0.2%
|
|
Ireland
|
2
|
0.4%
|
|
Italy
|
10
|
2.0%
|
|
Luxembourg
|
1
|
0.2%
|
|
Netherlands
|
12
|
2.4%
|
|
Norway
|
1
|
0.2%
|
|
Poland
|
1
|
0.2%
|
|
Spain
|
8
|
1.6%
|
|
Sweden
|
3
|
0.6%
|
|
Switzerland
|
17
|
3.4%
|
|
United Kingdom
|
28
|
5.6%
|
|
Sub – Total
|
|
162
|
32.4%
|
|
North America
|
Canada
|
11
|
2.2%
|
|
United States
|
135
|
27.0%
|
|
Sub – Total
|
|
146
|
29.2%
|
|
Oceania
|
Australia
|
9
|
1.8%
|
|
Sub – Total
|
|
9
|
1.8%
|
|
South America
|
Brazil
|
8
|
1.6%
|
|
Colombia
|
1
|
0.2%
|
|
Mexico
|
2
|
0.4%
|
|
Venezuela
|
1
|
0.2%
|
|
Sub – Total
|
|
12
|
2.4%
|
|
Total
|
|
500
|
100.0%
|
|
|
|
|
|
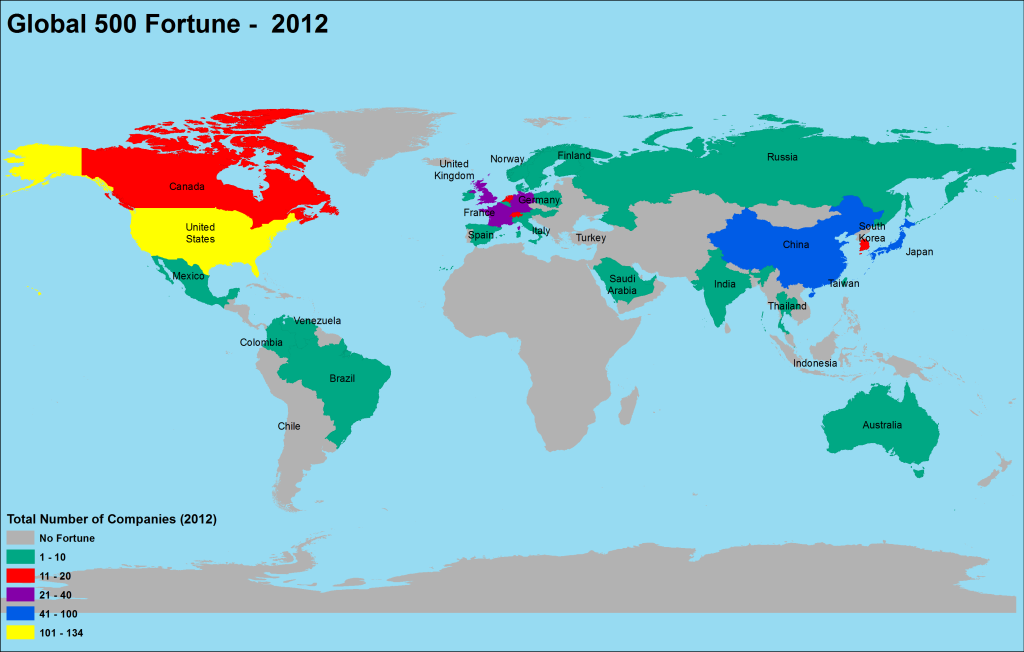
2012
|
|
|
Charts
|
|
|

|
|
|
Maps
|
|
|
|
|
|
Data
|
|
|
Continent
|
Country
|
Total Number
|
Percentage of Total
|
|
Asia
|
China
|
74
|
14.8%
|
|
India
|
8
|
1.6%
|
|
Japan
|
68
|
13.6%
|
|
Russia
|
7
|
1.4%
|
|
Saudi Arabia
|
1
|
0.2%
|
|
Singapore
|
2
|
0.4%
|
|
South Korea
|
14
|
2.8%
|
|
Taiwan
|
5
|
1.0%
|
|
Thailand
|
1
|
0.2%
|
|
United Arab Emirates
|
1
|
0.2%
|
|
Sub – Total
|
|
181
|
36.2%
|
|
Europe
|
Austria
|
1
|
0.2%
|
|
Belgium
|
4
|
0.8%
|
|
Denmark
|
1
|
0.2%
|
|
Finland
|
1
|
0.2%
|
|
France
|
33
|
6.6%
|
|
Germany
|
31
|
6.2%
|
|
Hungary
|
1
|
0.2%
|
|
Ireland
|
2
|
0.4%
|
|
Italy
|
9
|
1.8%
|
|
Luxembourg
|
1
|
0.2%
|
|
Netherlands
|
12
|
2.4%
|
|
Norway
|
1
|
0.2%
|
|
Poland
|
1
|
0.2%
|
|
Spain
|
8
|
1.6%
|
|
Sweden
|
4
|
0.8%
|
|
Switzerland
|
15
|
3.0%
|
|
United Kingdom
|
25
|
5.0%
|
|
Sub – Total
|
|
150
|
30.0%
|
|
North America
|
Canada
|
11
|
2.2%
|
|
United States
|
134
|
26.8%
|
|
Sub – Total
|
|
145
|
29.0%
|
|
Oceania
|
Australia
|
10
|
2.0%
|
|
Sub – Total
|
|
10
|
2.0%
|
|
South America
|
Brazil
|
9
|
1.8%
|
|
Colombia
|
1
|
0.2%
|
|
Mexico
|
3
|
0.6%
|
|
Venezuela
|
1
|
0.2%
|
|
Sub – Total
|
|
14
|
2.8%
|
|
Total
|
|
500
|
100.0%
|
|
|
|
|
|
2013
|
|
|
Charts
|
|
|

|
|
|
Maps
|
|
|

|
|
|
Data
|
|
|
Continent
|
Country
|
Total Number
|
Percentage of Total
|
|
Asia
|
China
|
89
|
17.8%
|
|
India
|
8
|
1.6%
|
|
Indonesia
|
1
|
0.2%
|
|
Japan
|
62
|
12.4%
|
|
Malaysia
|
1
|
0.2%
|
|
Russia
|
7
|
1.4%
|
|
Saudi Arabia
|
1
|
0.2%
|
|
Singapore
|
2
|
0.4%
|
|
Taiwan
|
6
|
1.2%
|
|
Thailand
|
1
|
0.2%
|
|
Turkey
|
1
|
0.2%
|
|
South Korea
|
14
|
2.8%
|
|
United Arab Emirates
|
1
|
0.2%
|
|
Sub – Total
|
|
194
|
38.8%
|
|
Europe
|
Austria
|
1
|
0.2%
|
|
Belgium
|
3
|
0.6%
|
|
Denmark
|
1
|
0.2%
|
|
Finland
|
1
|
0.2%
|
|
France
|
31
|
6.2%
|
|
Germany
|
29
|
5.8%
|
|
Hungary
|
1
|
0.2%
|
|
Ireland
|
2
|
0.4%
|
|
Italy
|
8
|
1.6%
|
|
Luxembourg
|
2
|
0.4%
|
|
Netherlands
|
11
|
2.2%
|
|
Norway
|
1
|
0.2%
|
|
Poland
|
1
|
0.2%
|
|
Spain
|
8
|
1.6%
|
|
Sweden
|
3
|
0.6%
|
|
Switzerland
|
14
|
2.8%
|
|
United Kingdom
|
27
|
5.4%
|
|
Sub – Total
|
|
144
|
28.8%
|
|
North America
|
Canada
|
9
|
1.8%
|
|
United States
|
132
|
26.4%
|
|
Sub – Total
|
|
141
|
28.2%
|
|
Oceania
|
Australia
|
8
|
1.6%
|
|
Sub – Total
|
|
8
|
1.6%
|
|
South America
|
Brazil
|
8
|
1.6%
|
|
Colombia
|
1
|
0.2%
|
|
Mexico
|
3
|
0.6%
|
|
Venezuela
|
1
|
0.2%
|
|
Sub – Total
|
|
13
|
2.6%
|
|
Total
|
|
500
|
100.0%
|
|
|
|
|
|
2014
|
|
|
Charts
|
|
|

|
|
|
Maps
|
|
|
|
|
|
Data
|
|
|
Continent
|
Country
|
Total Number
|
Percentage of Total
|
|
Asia
|
China
|
95
|
19.0%
|
|
India
|
8
|
1.6%
|
|
Indonesia
|
2
|
0.4%
|
|
Japan
|
57
|
11.4%
|
|
Russia
|
8
|
1.6%
|
|
Saudi Arabia
|
1
|
0.2%
|
|
Singapore
|
2
|
0.4%
|
|
South Korea
|
17
|
3.4%
|
|
Taiwan
|
4
|
0.8%
|
|
Thailand
|
1
|
0.2%
|
|
Turkey
|
1
|
0.2%
|
|
United Arab Emirates
|
1
|
0.2%
|
|
Sub – Total
|
|
197
|
39.4%
|
|
Europe
|
Austria
|
1
|
0.2%
|
|
Belgium
|
2
|
0.4%
|
|
Denmark
|
1
|
0.2%
|
|
Finland
|
1
|
0.2%
|
|
France
|
32
|
6.4%
|
|
Germany
|
27
|
5.4%
|
|
Ireland
|
2
|
0.4%
|
|
Italy
|
9
|
1.8%
|
|
Luxembourg
|
1
|
0.2%
|
|
Netherlands
|
12
|
2.4%
|
|
Norway
|
1
|
0.2%
|
|
Poland
|
1
|
0.2%
|
|
Spain
|
8
|
1.6%
|
|
Sweden
|
3
|
0.6%
|
|
Switzerland
|
12
|
2.4%
|
|
United Kingdom
|
27
|
5.4%
|
|
Sub – Total
|
|
140
|
28.0%
|
|
North America
|
Canada
|
10
|
2.0%
|
|
United States
|
131
|
26.2%
|
|
Sub – Total
|
|
141
|
28.2%
|
|
Oceania
|
Australia
|
9
|
1.8%
|
|
Sub – Total
|
|
9
|
1.8%
|
|
South America
|
Brazil
|
8
|
1.6%
|
|
Chile
|
1
|
0.2%
|
|
Colombia
|
1
|
0.2%
|
|
Mexico
|
2
|
0.4%
|
|
Venezuela
|
1
|
0.2%
|
|
Sub – Total
|
|
13
|
2.6%
|
|
Total
|
500
|
100.0%
|
|
|
|
|


Kat
18 Jan 2017Hi, Will you send me the shapefiles and data to do this on gis please
André Nakamura
20 Mar 2018Can you please send me the data used to do the charts?
Malik Usama
8 Jun 2021Can you please send me the data used to do the charts?